
Each Wednesday this article will be updated with the current seasonal study using CQG's Seasonal analysis applied to the Soybean, Wheat and Corn markets. You can download the CQG pac providing the studies and charts here. In addition, the seasonal data lines can be pulled into Excel using RTD formulas.
Below each chart are two tables. The first table is the highest correlation of the current market data to the seasonal year using a 20-day, 50-day, 100-day and the 200-day lookback periods. The second table is the previous week's data. Seasonal analysis is about price direction or the trend.
Soybeans
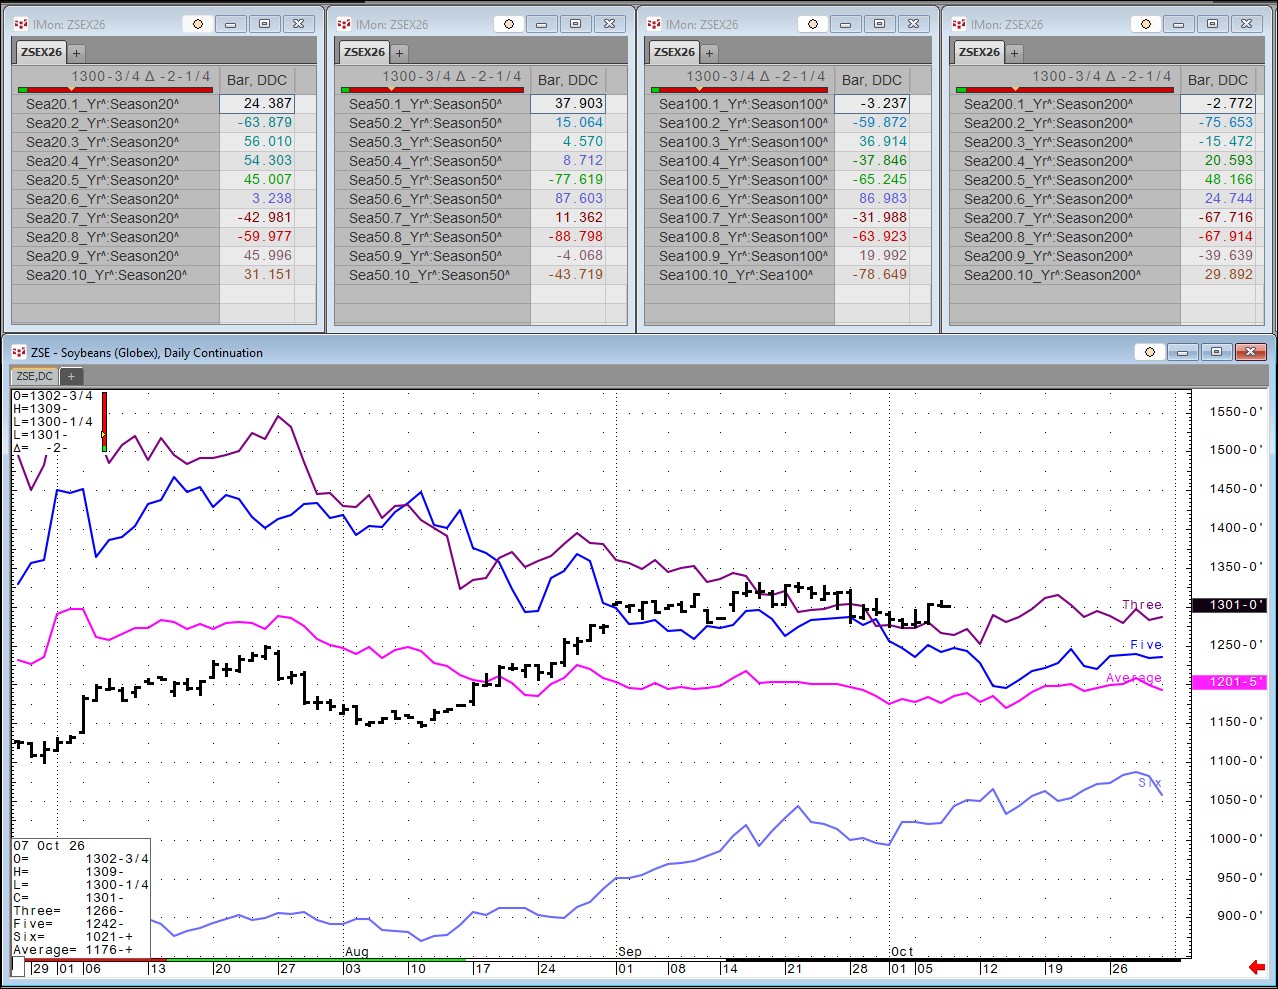
| This Week's Data | ||||
| Correlation Lookback (Days) | 20 | 50 | 100 | 200 |
| Seasonal Year Back with the Highest Correlation | 3_Yr 56.01 | 6_Yr 87.60 | 6_Yr 86.98 | 5_Yr 48.17 |
| Last Week's Data | ||||
| Correlation Lookback (Days) | 20 | 50 | 100 | 200 |
| Seasonal Year Back with the Highest Correlation | 10_Yr 26.77 | 6_Yr 89.84 | 6_Yr 86.50 | 5_Yr 54.43 |
Wheat
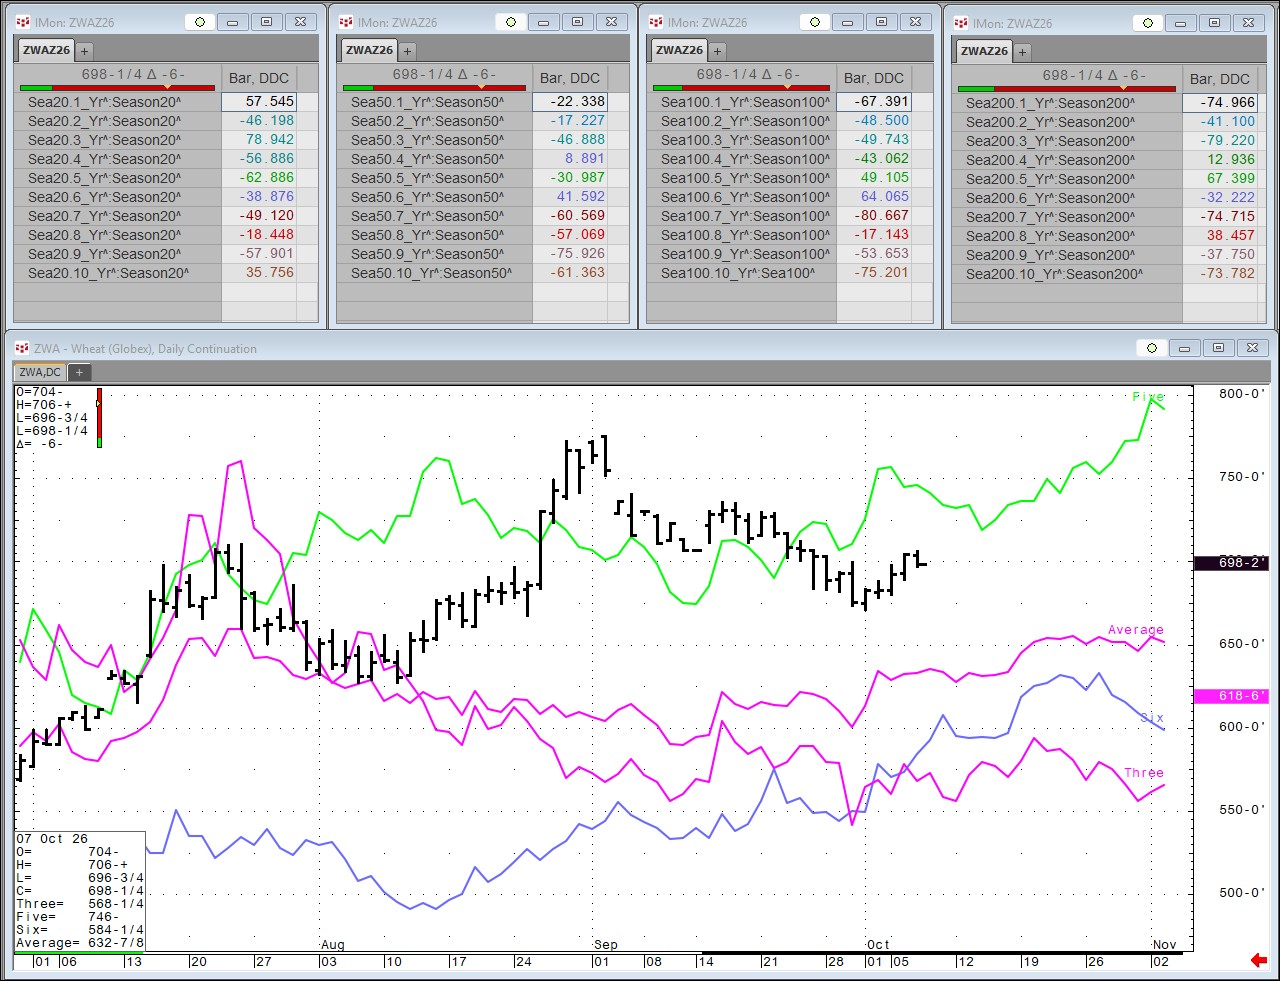
| This Week's Data | ||||
| Correlation Lookback (Days) | 20 | 50 | 100 | 200 |
| Seasonal Year Back with the Highest Correlation | 3_Yr 78.94 | 6_Yr 41.59 | 6_Yr 64.07 | 5_Yr 67.40 |
| Last Week's Data | ||||
| Correlation Lookback (Days) | 20 | 50 | 100 | 200 |
| Seasonal Year Back with the Highest Correlation | 3_Yr 57.65 | 6_Yr 56.01 | 6_Yr 68.20 | 5_Yr 69.20 |
Corn
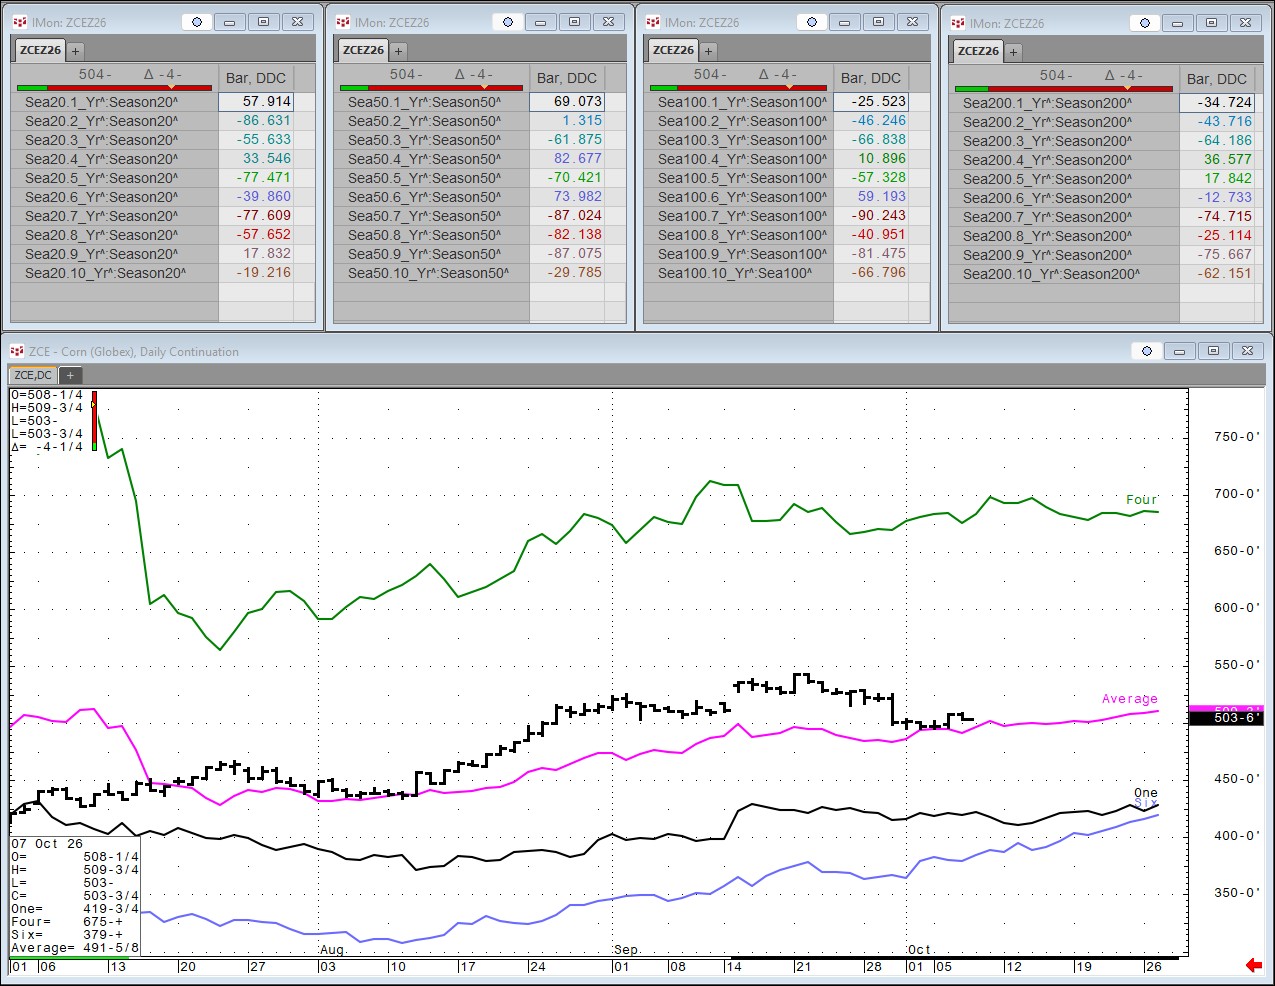
| This Week's Data | ||||
| Correlation Lookback (Days) | 20 | 50 | 100 | 200 |
| Seasonal Year Back with the Highest Correlation | 1_Yr 57.91 | 4_Yr 82.68 | 6_Yr 59.19 | 4_Yr 36.58 |
| Last Week's Data | ||||
| Correlation Lookback (Days) | 20 | 50 | 100 | 200 |
| Seasonal Year Back with the Highest Correlation | 4_Yr 11.17 | 6_Yr 90.00 | 6_Yr 60.16 | 4_Yr 37.34 |