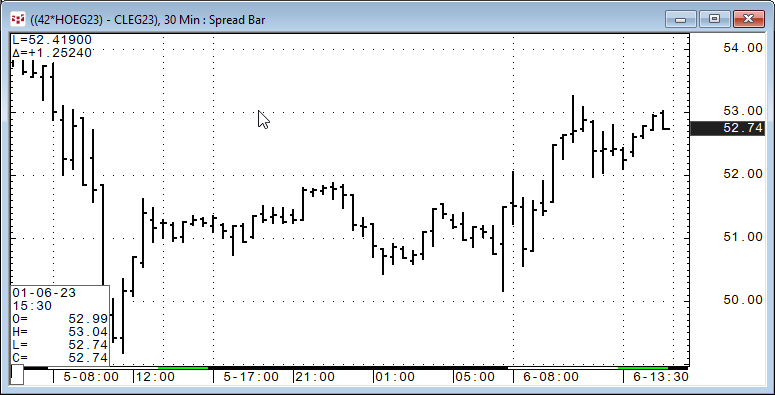
The Spread Bar chart displays spread bar values based on a user set parameter for snap shots at certain intervals.
This is a superior method to simply plotting the spread prices. For… more
The Spread Bar chart displays spread bar values based on a user set parameter for snap shots at certain intervals.
This is a superior method to simply plotting the spread prices. For… more
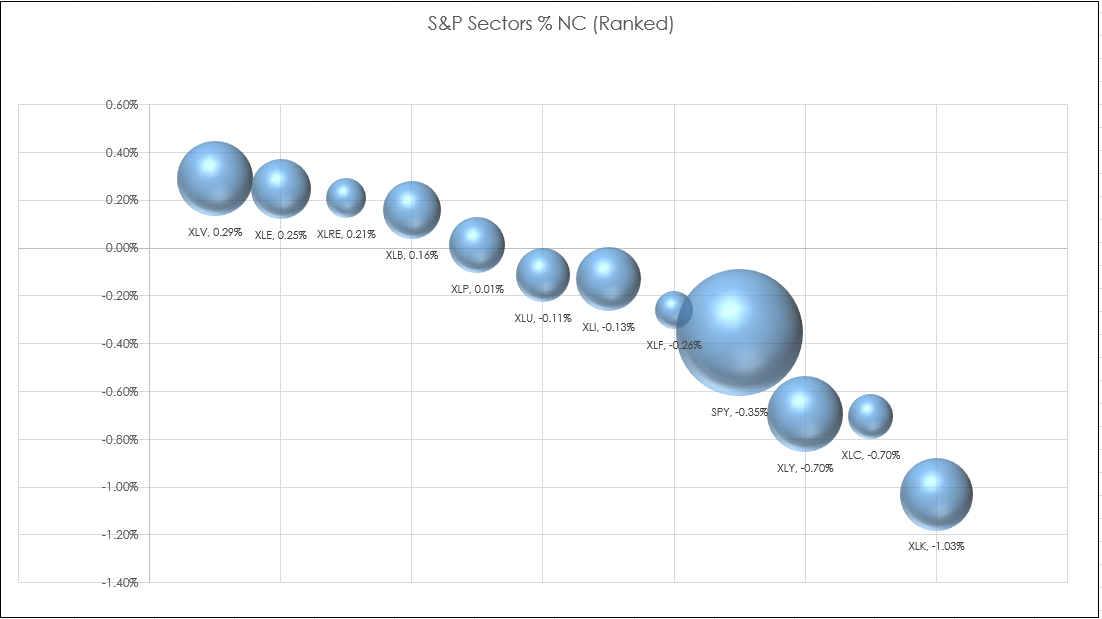
The Microsoft® Excel 3-D chart is different from the Excel Scatter Plot chart. The Scatter chart uses a fixed size for the chart data points. The 3-D chart accesses an additional column to set the… more