
This midweek look shows the Nikkei 225 (Osaka), Sep 26 contract, with a loss of -3.87%. The best performer in the US market is the E-mini Dow 400, Sep 26 contract showing a gain of +0.08%.… more

Midweek, the OSE 10 Year JGB, Sep 26 contract is higher by +0.32%. The best performer in the US market is the 30yr US Treasury Bond (Globex), Sep 26 contract, which is higher by +0.51%. The… more

Each Wednesday this article will be updated with the current seasonal study using CQG's Seasonal analysis applied to the Soybean, Wheat and Corn markets. You can download the CQG pac providing the… more
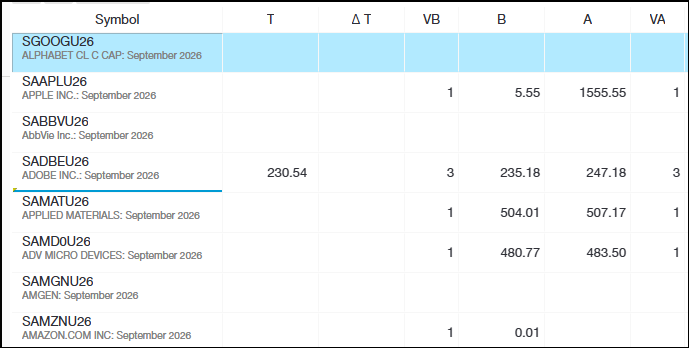
The CME is now offering Single Stock Futures trading. The benefits include:
Around-the-clock trading access. Futures trade nearly 24 hours a day (17:00 CST to 16:00 CST) allowing you to trade… more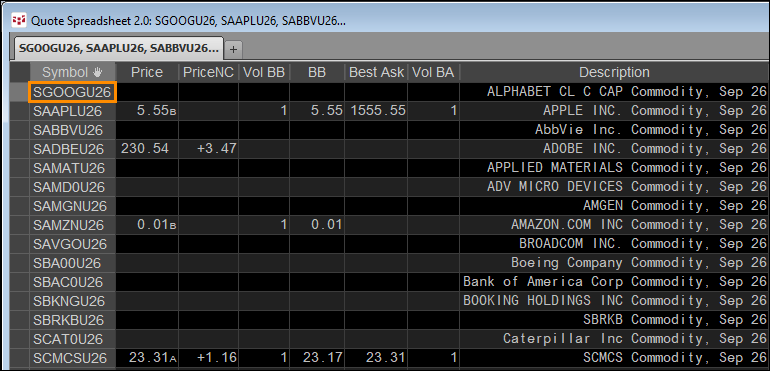
The CME is now offering Single Stock Futures trading. The benefits include:
Around-the-clock trading access. Futures trade nearly 24 hours a day (17:00 CST to 16:00 CST) allowing you to trade… more
The midterm elections will determine the U.S. foreign and domestic policy initiativesHistory favors the opposition partyDivision within the opposition partyThe rising odds of challenges to the… more
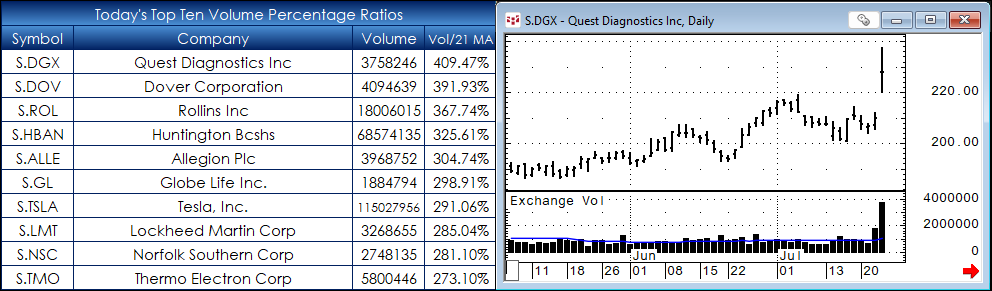
This post is another example of using Excel functions and RTD calls to screen a large portfolio. The sample dashboard is the holdings of the S&P 500® Index (as of 7/20/2026). The screening is… more

This midweek look shows the Nikkei 225 (Osaka), Sep 26 contract, with a gain of +3.97%. The best performer in the US market is the E-mini NASDAQ 100, Sep 26 contract showing a gain of +1.67… more
Midweek, the OSE 10 Year JGB, Sep 26 contract is lower -0.42%. The best performer in the US market is the 2yr US Treasury Note (Globex), Sep 26 contract, which is lower by -0.2161%. The… more
Each Wednesday this article will be updated with the current seasonal study using CQG's Seasonal analysis applied to the Soybean, Wheat and Corn markets. You can download the CQG pac providing the… more