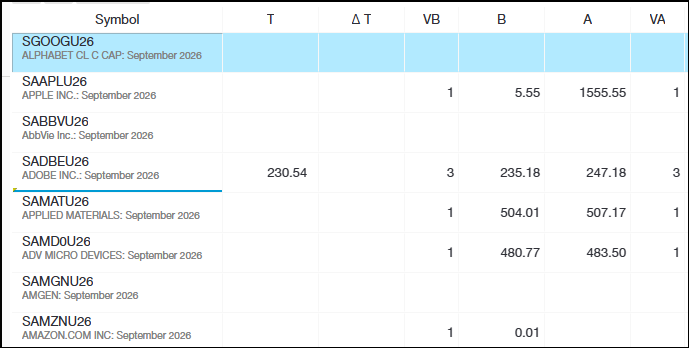
The CME is now offering Single Stock Futures trading. The benefits include:
Around-the-clock trading access. Futures trade nearly 24 hours a day (17:00 CST to 16:00 CST) allowing you to trade… moreWorkspaces
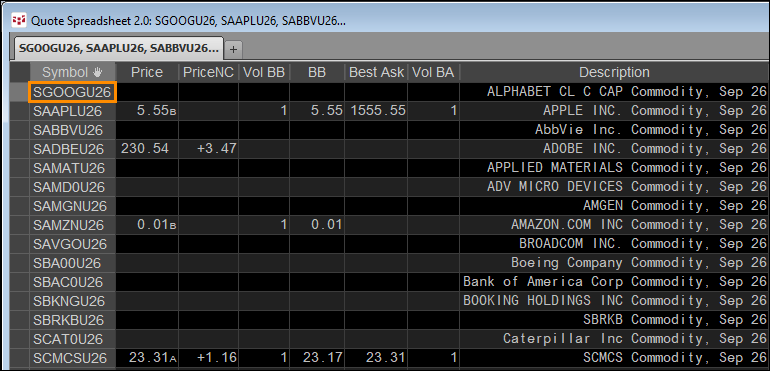
The CME is now offering Single Stock Futures trading. The benefits include:
Around-the-clock trading access. Futures trade nearly 24 hours a day (17:00 CST to 16:00 CST) allowing you to trade… more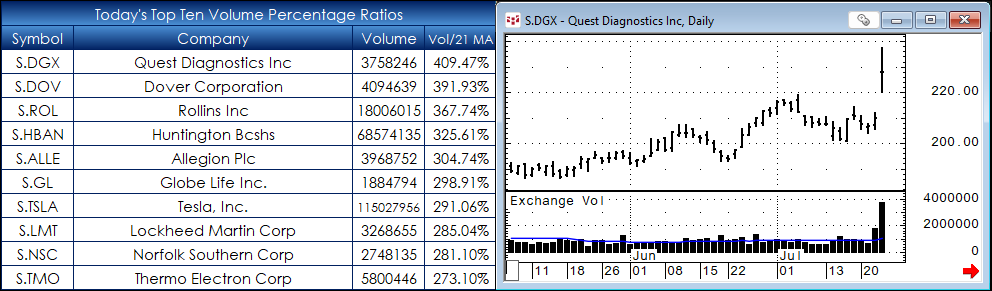
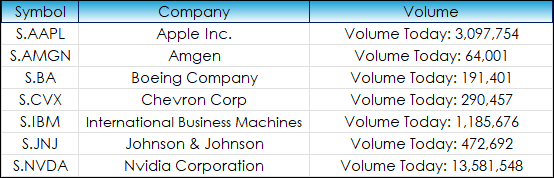
This post is another example of using Excel functions and RTD calls to screen a large portfolio. The sample dashboard is the holdings of the S&P 500® Index (as of 7/20/2026). The screening is… more
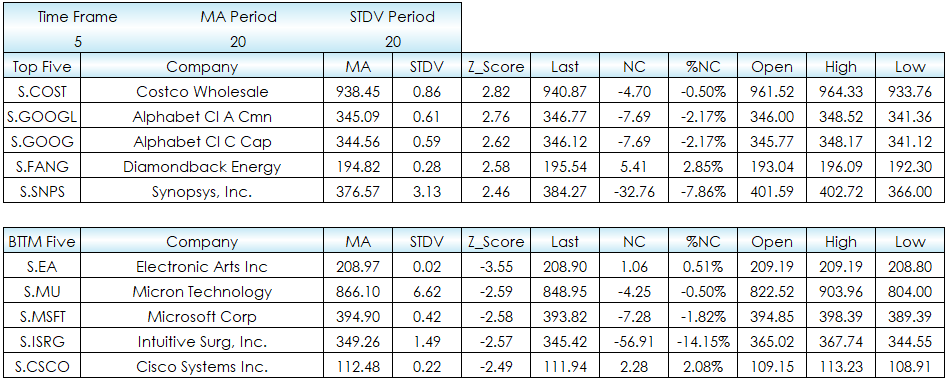
This post details an Excel dashboard for measuring the Z-Score of stocks from the NASDAQ 100. The dashboard sets the parameters as user defined inputs for the time frame, the average lookback… more
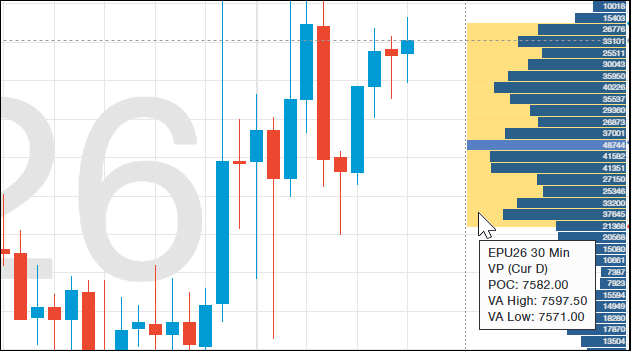
This post details CQG One's Volume Profile Study.
Once applied to a chart, the study calculates the Profile's Value Area and Point of Control (POC).
The value area begins calculating… more
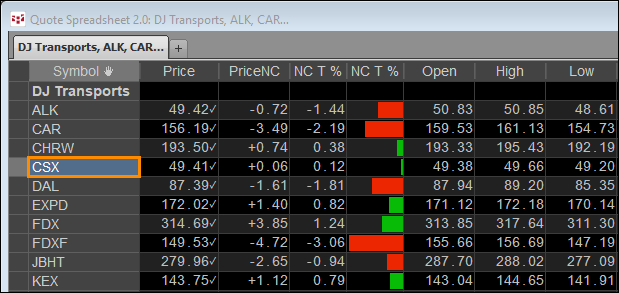
This post offers a downloadable CQG PAC for installing the DJT and DJU Page in CQG IC or QTrader. The page details the current session's market performance of the constituents of the two averages… more
Excel has some very useful functions for screening market performance data and filtering large amounts of data to highlight particular user defined results for further analysis.
This post… more
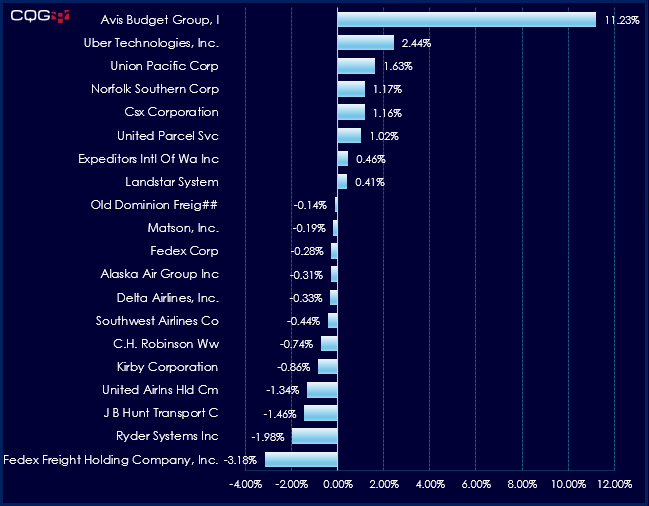
This post offers a downloadable Excel Dashboard that details the current session's market performance of the constituents of the two averages.
The top block of the dashboard is the Dow Jones… more
Updated 06/30/2026 to add ALPHABET CL A CMN (Symbol: S.GOOGL) and remove Verizon Communications (Symbol: S.VZ)
This Microsoft Excel® spreadsheet tracks the constituents of the DJIA Index (… more
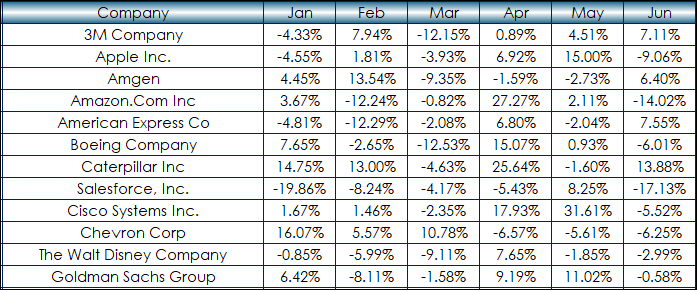
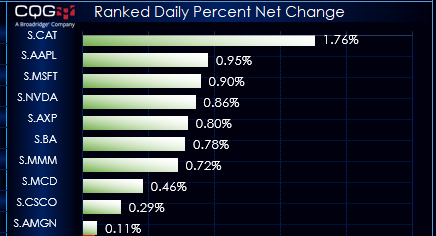
This post details using a nested XLOOKUP function to pull data from a matrix. The matrix displays the monthly percentage net change using a column for the symbols and a row for the months. The RTD… more