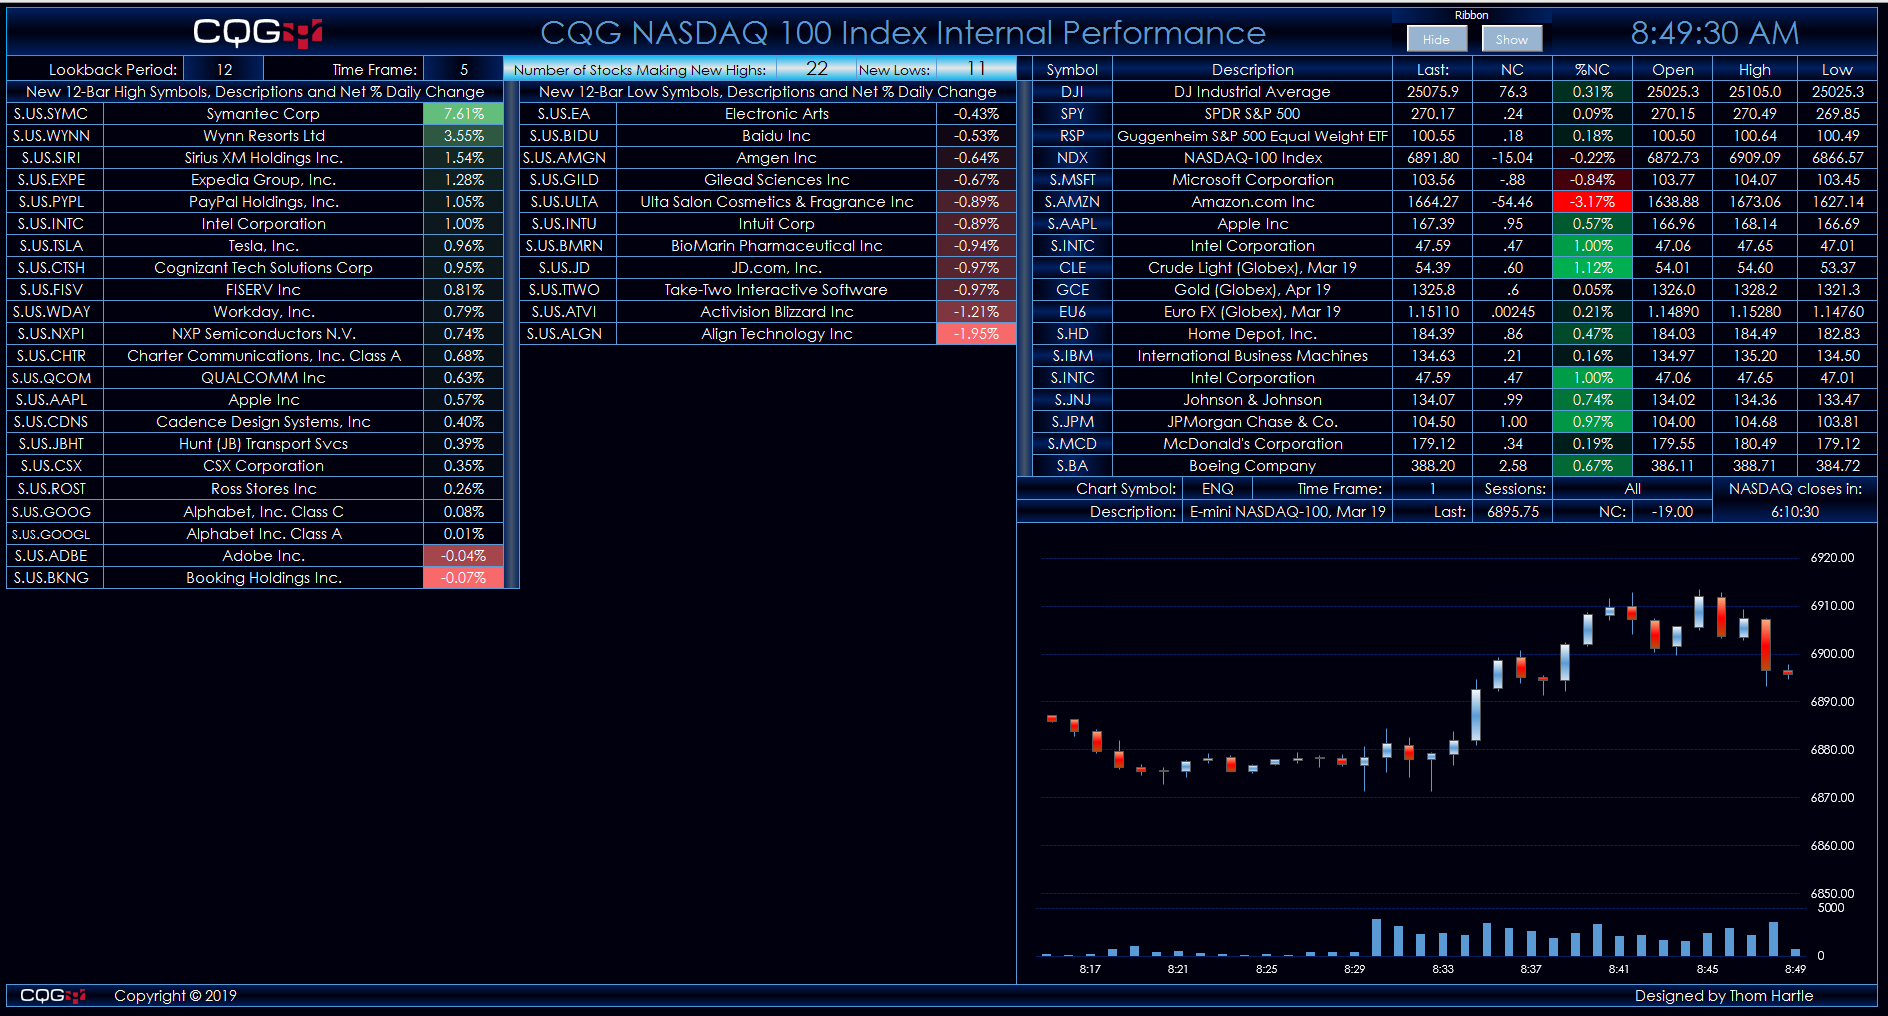
This Microsoft Excel® dashboard tracks the 104 stocks in the Nasdaq-100 index using CQG’s Level function. The Level function plots two lines, which identify the highest and lowest price levels… more
Workspaces
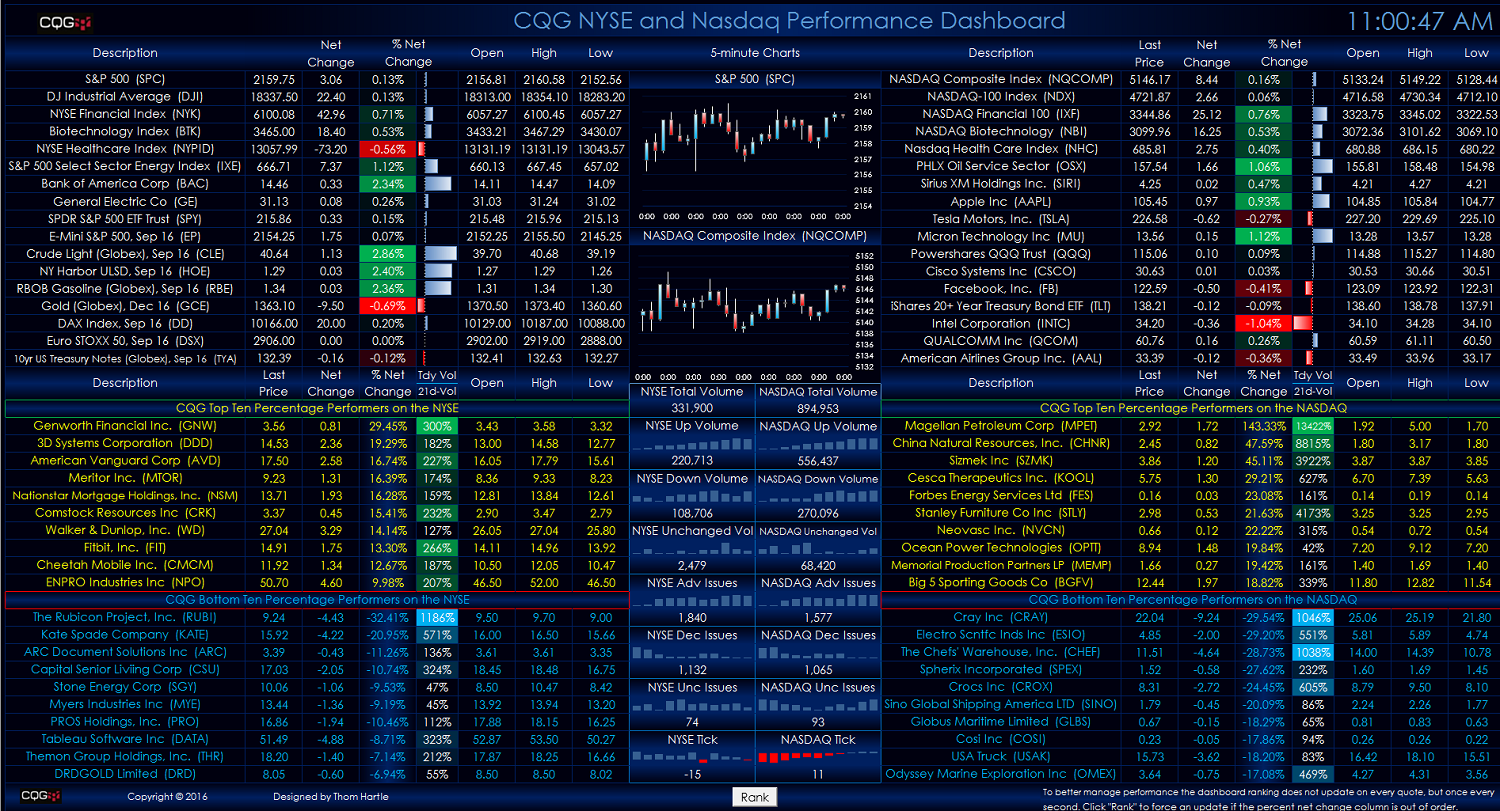
This Microsoft Excel® dashboard offers a two-window view for tracking market performance (You have to enable macros when this dashboard is first opened.) The top half displays market data using… more