In this article, we will review a CQG indicator that has been available for many years and is still very relevant. It is possible to find divergence using the CQG formula toolbox, but it usually results in quite complicated and longwinded studies and conditions. With Divergence Index (Diver), there is a very powerful shortcut for this task.
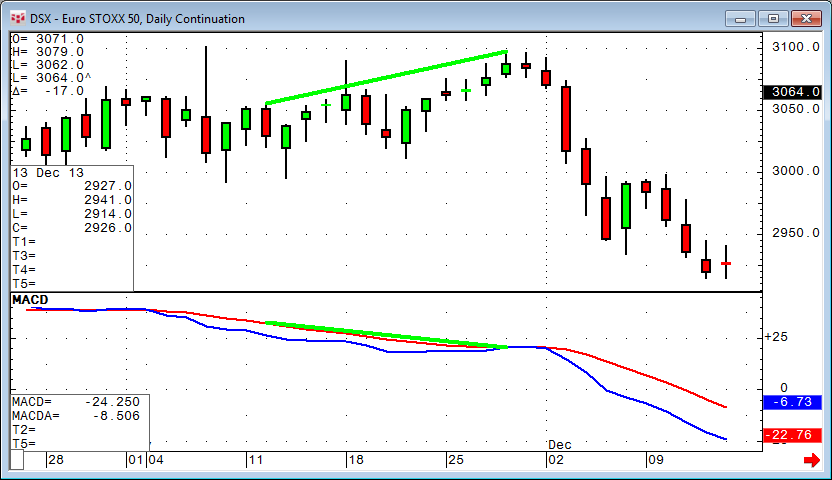
Generally speaking, a divergence is the mismatch between the market price and your preferred indicator. In this simple example, the upper trend line on the price chart connecting two significant highs is showing an upward slope, where the same days connected on the indicator (MACD) is showing a down slope. This is divergence.
Divergence Index has the ability to find these situations automatically, and it also tries to quantify the strength of the divergence.
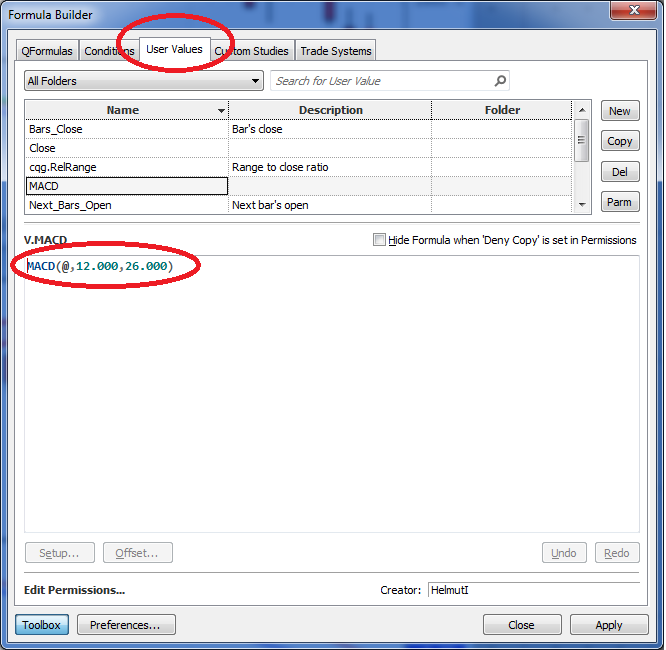
To get there, we need to prepare one little sidestep first. We want to find divergence between the market and the MACD indicator in this example; therefore, we need to create a User Value using CQG's formula toolbox. The User Value simply contains the designated indicator for the research.
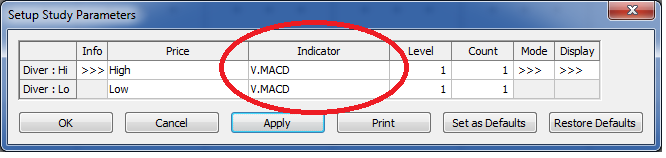
After we apply Diver to the chart, we need to change the default parameters in order to reference our user value V.MACD instead of the default close.
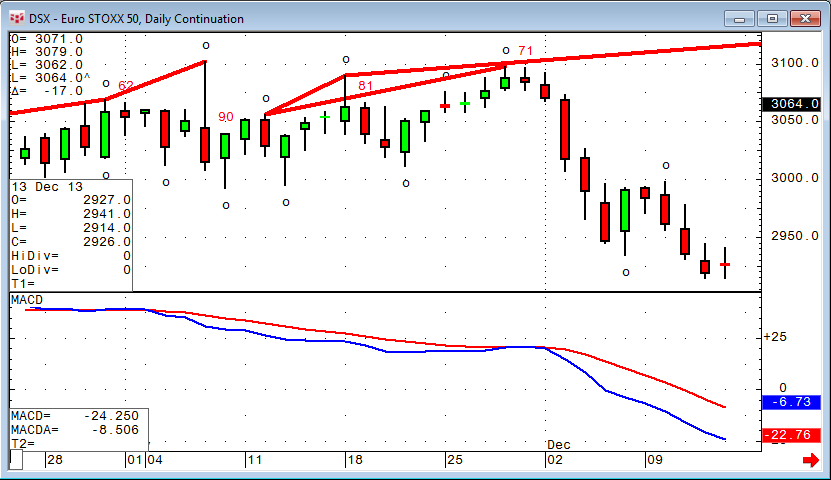
With these basic settings, we have the Divergence Index working.
As the next step, there is a whole set of parameters to control the quantity and significance of the measurements. In our example, we use the following settings, but these are not magic numbers - you might want to play around with the parameters to find the best solution for your markets.
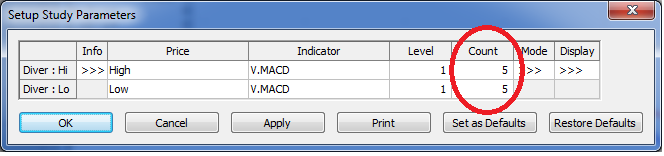
The Level parameter indicates where the left point (the circles) of the trend lines are placed by specifying the number of lower highs that must occur on both sides of the peak in order to advance the circle. Lower Level parameter values result in shorter trend lines.
The next section is Mode. Mode allows customers to select the types of divergence to display.
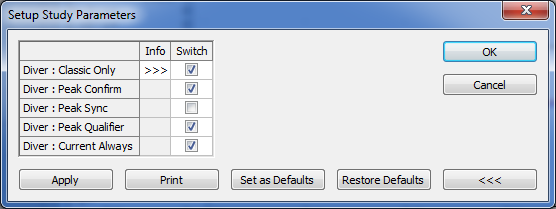
Mode:
Classic Only: When selected, divergence is indicated when the slope of the bar chart trend line is upward and the slope of the oscillator trend line is negative, or the slope of the bar chart trend line is downward and slope of the oscillator trend line is positive.
Peak Confirm: When selected, divergence is measured (at the right-hand point of the trend lines) at every peak (trough), which is confirmed by one lower high (higher low) to the right. Therefore, the divergence signal does not occur until the close of the bar following the current peak. This peak is judged for its likelihood of being a significant reversal point.
Peak Sync: When selected, the oscillator trend line may not use the same points in time as the one placed on the bar. Instead, the study seeks the price peaks (troughs) and uses them to place the trend line on the oscillator. These points can be shifted either left or right of the price peaks. The system makes these shifts by looking at the slope of the oscillator at the time of the price peak. If the slope is upward for a peak or downward for a trough, it moves the oscillator point to the right until just before the slope turns down (or up in case of a trough). If the slope is downward for a peak or upward for a trough, it moves the oscillator point to the left until just after the slope turns up (or down in case of a trough).
Peak Qualifier: When selected, the second price peak must be greater than the first price peak for upside divergence, and the second valley must be lower than the first valley for downside divergences.
Current Always: When selected, divergence is measured at the current bar all the time. The study will not wait for a lower high (higher low) to confirm the divergence at the current bar.
Following is the Display section.
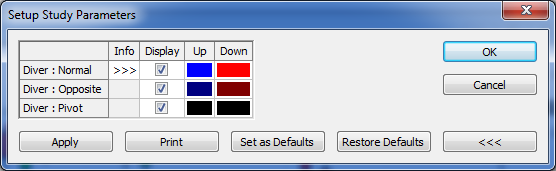
Display:
Normal: For peaks, normal is represented by trend lines moving away from each other. For troughs, normal is represented by the trend lines converging.
Opposite: For peaks, opposite is represented by trend lines moving away towards each other. For troughs, opposite is represented by the trend lines moving away from each other.
Pivot: Pivot is used to mark the left points of the trend lines that are used to measure divergence.
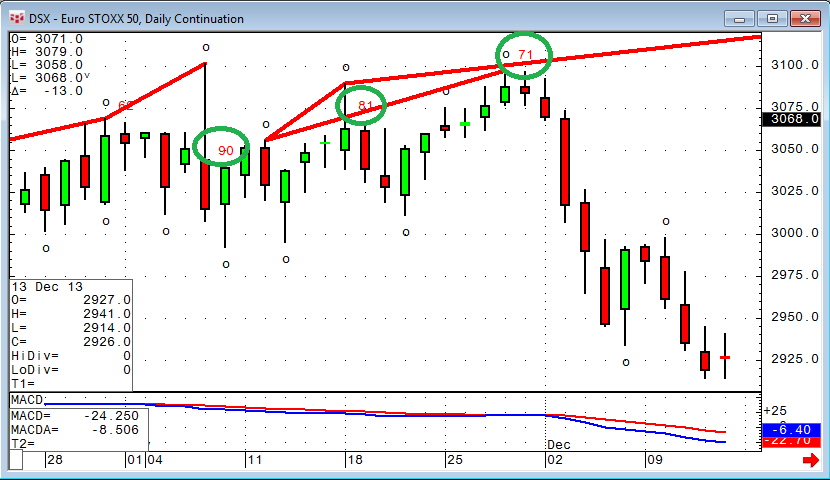
The numbers on the chart are measuring the strength of the divergence that ranges from +100 to -100.
For a full description, see CQG's online help.