Recently, we had a request to show, in real time, how many contracts are available on the buy and sell side in the order book. This can be accomplished with a very simple study: DOM Ask Volume (DomAskVo) (and DomBidVo for Dom Bid Volume).
This study is available under the Functions tab on the Add Study window and in the Formula Toolbox.
DOM Ask Volume (Depth of Market Ask Volume) represents the number of contracts or shares available at the lowest offering price. The full features from the help file of the study are detailed here:

To build the custom study, open the Toolbox and insert the function from the Functions group.
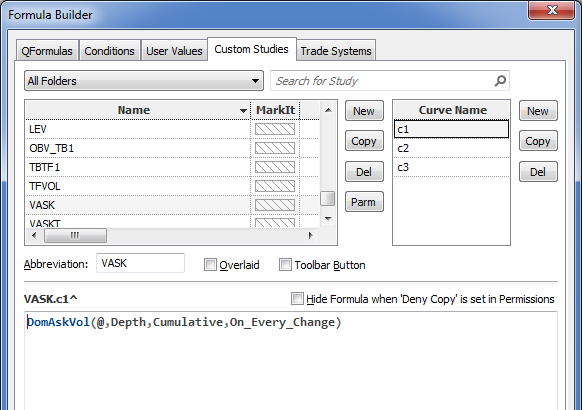
Here, curve C1 is the DOM Ask Volume, curve C2 is the DOM Bid Volume, and curve C3 is the sum of both.
The Depth parameter decides how many prices up and down the ladder are taken into the calculation. My default is 10, giving me the volumes of the ten best bids and asks.
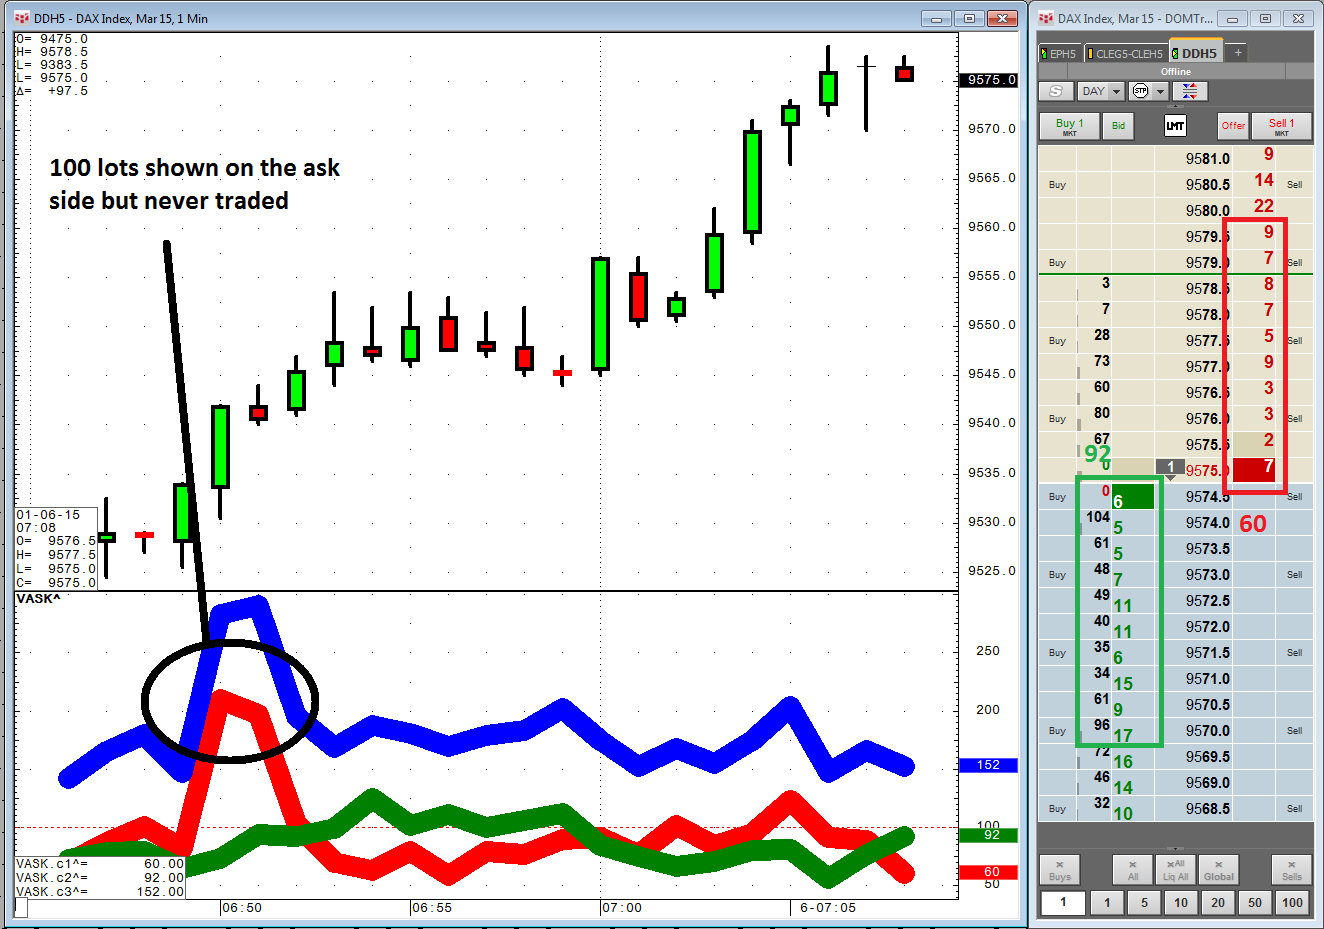
The values fluctuate during bar building and represent the last second of the bar as it closes. This particular data set is built locally on your client. Consequently, the values will disappear when you minimize the chart or hit refresh. The data is not available for backtesting. A pac is available to download and run with CQG IC or CQG QTrader.
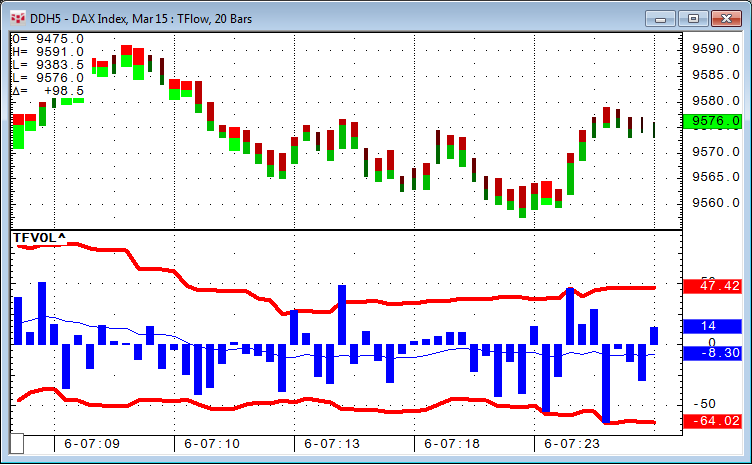
Another interesting study is the difference between bid and ask volume on a TFlow chart.
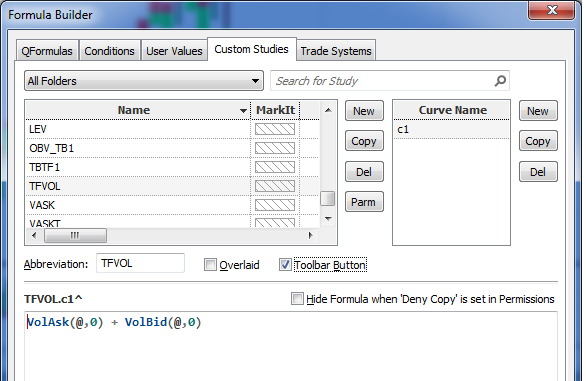
To create this custom study, called TFVOL, you open the Toolbox and select VolAsk and VolBid from the Volume Study group. The formula reads VolAsk + VolBid because VolBid is represented as a negative number. This custom study is also in the pac.
The TFlow chart below shows the standard volume study and this custom study.
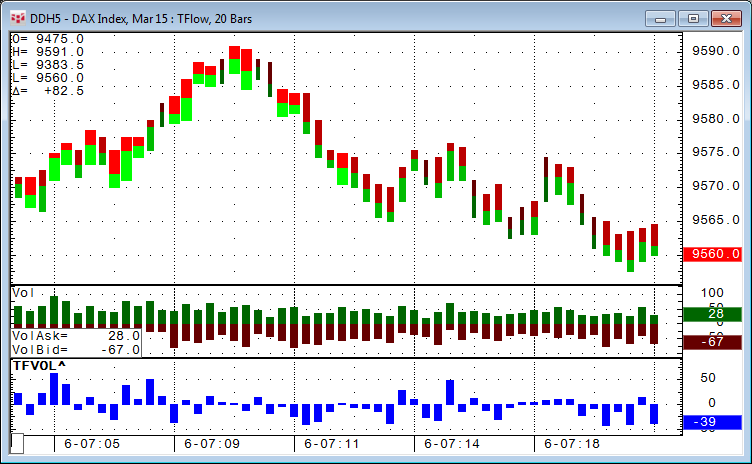
This is just the beginning of TFlow volume analysis. As the next step, we could add Bollinger Bands to the mix in order to find out what spikes are within two standard deviations, and if any of the spikes are outside the two standard deviations.
The first study tracks the volume in the exchange order book queues. The second study tracks the actually traded volumes at the best bid and ask price levels. The values are stored in the database and can be called at any time.
Seasoned traders know the value of watching more than just the price action. They also track the traded volume at each price for more insight into the behavior of the market.