This is a collection of frequently requested studies, which are not part of CQG’S standard offering. These studies are open source and detailed descriptions can be easily found on the internet. Your CQG Application Specialists have created these studies inside our formula toolbox for you to use or re-engineering purposes.
- Dynamic Momentum Index
- Chande Momentum Oscillator
- Guppy and Guppy2 (exp)
- McClellan Oscillator
- Money Flow Index – MFI
- Relative Momentum Index (RMI)
- Relative Vigor Index - RVI
- Bonus: Parabolics Trading System*
Dynamic Momentum Index
The dynamic momentum index is used in technical analysis to determine if a security is overbought or oversold. This indicator, developed by Tushar Chande and Stanley Kroll, is very similar to the relative strength index (RSI). The main difference between the two is that the RSI uses a fixed number of time periods (usually 14), while the dynamic momentum index uses different time periods as volatility changes, typically between 5 and 30.
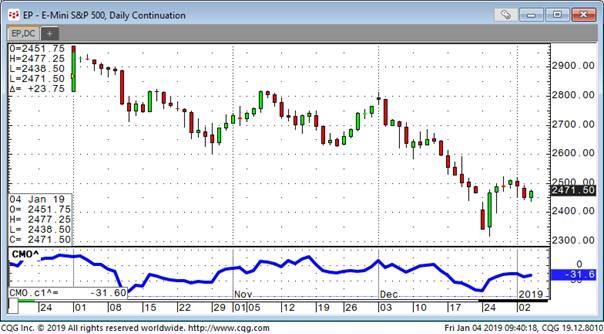
Chande Momentum Oscillator
The Chande momentum oscillator is a technical momentum indicator invented by Tushar Chande. Chande introduced the indicator in his 1994 book The New Technical Trader. It is created by calculating the difference between the sum of all recent gains and the sum of all recent losses and then dividing the result by the sum of all price movement over the period.
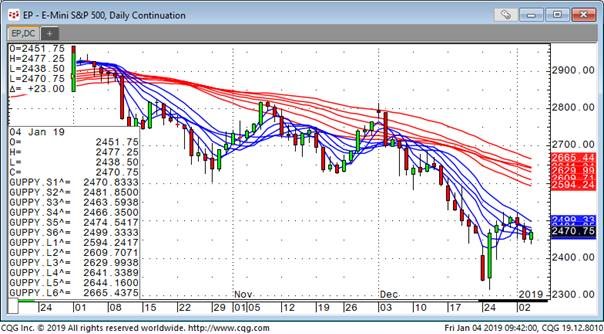
Guppy Multiple Moving Average
The Guppy Multiple Moving Average is a technical indicator that identifies changing trends by combining two groups of moving averages with differing time periods. The term gets its name from Daryl Guppy, an Australian trader who is credited with its development. Guppy2 is a version using exponential moving averages instead of simple moving averages.
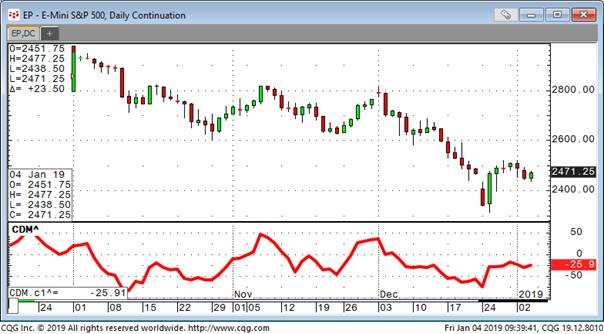
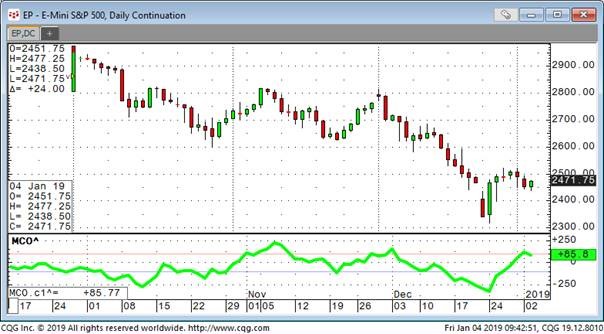
McClellan Oscillator
The McClellan Oscillator is a market breadth indicator used in technical analysis by financial analysts of the New York Stock Exchange to evaluate the balance between the advancing and declining stocks. The McClellan oscillator is based on the Advance-Decline Data and it could be applied to stock market exchanges, indexes, portfolio of stocks, or any basket of stocks.
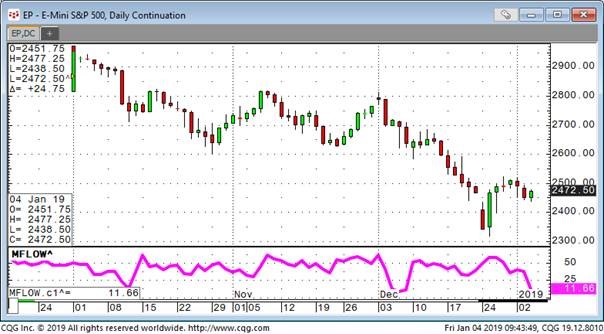
Money Flow Index
The Money Flow Index (MFI) is a technical oscillator used for identifying overbought or oversold conditions for an individual security or an ETF or index.
Unlike conventional oscillators such as the relative strength index (RSI), the MFI incorporates both price and volume data, as opposed to just price. For this reason, some analysts know it as volume-weighted RSI. However, it is as easy to read as other oscillators, with extremes at readings of 0 and 100.
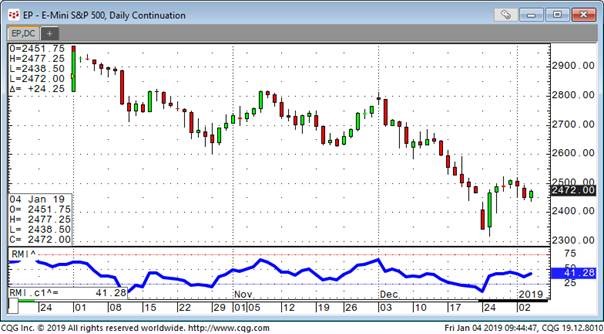
Relative Momentum Index
The Relative Momentum Index (RMI) was developed by Roger Altman in 1993 as an attempt to improve the Relative Strength Index (RSI) by adding a component of momentum to the RSI. The Relative Momentum Index uses change of closing price between the current bar and N bars before instead of 1-dar change in price.
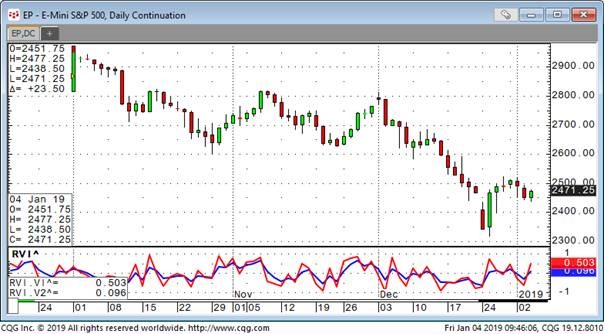
Relative Vigor Index
The Relative Vigor Index (RVI) is a technical analysis indicator that measures the strength of a trend by comparing a security's closing price to its price range and smoothing the results using an exponential moving average (EMA). It's based on the fact that prices tend to close higher than they open in uptrends, and closer lower than they open in downtrends.
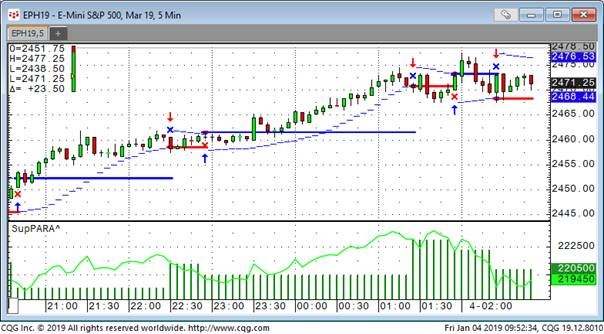
Parabolics Trading System
As a bonus, we added the Parabolic Trading system (SupPARA). The trading system is based on the Parabolic (Para) Study:
Parabolic (Para)
Welles Wilder's Parabolic SAR study is a time/price reversal system. The letters "SAR" stand for "stop and reverse" meaning that the position is reversed when the protective stop is hit.
It is a trend-following system. As prices trend higher, the SARs tend to start out slower and then accelerate with the trend. In a downtrend, the same thing happens but in the opposite direction. The SAR numbers are calculated and available to the user for the following day based on the following equation:

where: AF begins at 0.020 (default value) and is increased by .02 each bar that a new high/low is made (depending on the trend direction) until a value of 0.20 is reached; EP = Extreme Price point for the trade made so far (if Long, EP is the extreme high price for the trade; if Short, EP is the extreme low price for the trade).
Thus, the Parabolic Time/Price System rides the trend until the SAR price is penetrated. Then the existing position is closed out and the reverse position is opened.
Here are the parms to be modified:
- STEP – Matches the parabolic indicator.
- START – Matches the parabolic indicator.
- MAX – Matches the parabolic indicator.
- EOD – End-of-Day will exit any position at the last bar of the day when checked.
- MMstop – Money Management is a simple stop-loss. You just need to specify the amount.
- MM – Money Management Stop is on if checked.
- BEFloor – Break Even Exit will close the position when it returns to its entry price. It needs to reach a certain amount of profit (Floor) before it is activated.
- BE – Break Even Exit is on if checked.
- DRTstop – Dollar Risk Trailing is a classic trailing stop that is based on maximum profit during the trade (calculated by each close).
- DRT – Dollar Risk Trailing is on if checked.
- PRTstop – Percent Risk Trailing puts a stop below the maximum profit close to risk x% of the money already gained in the trade. The value is in percent.
- PRTfloor – Percent Risk Trailing needs to reach a certain amount of profit (Floor) before it is activated.
- PRT – Percent Risk Trailing is on if checked.
- PTtarget – Profit Target exits a position if a certain amount of money is gained.
- PT – Profit Target is on if checked.
- ATRperiod – Average True Range trailing stop uses the value of the Average True Range study when a trade is initiated. ATR Period is the length of the ATR measurement.
- ATRfactor – ATR Factor is the parameter that determines how many ATRs the stop is placed away from the market.
- ATR – Average True Range trailing stop is on when checked.
- ES – Entry Stop places an initial stop on the low (for long trades) or on the high (for short trades) of the entry bar. Entry Stop is on if checked.
- Quantity – Quantity is the trading size, in contracts, for a stock or future trade.
- FX – If FX markets are traded, the quantity gets multiplied by 100,000. If you want a clip size of 1,000,000 per trade, that is a quantity of ten with the FX multiplier checked.
* For the trading system you need to have backtesting and autotrading enabled! If you don’t have this CQG feature right now, feel free to request a free two week trial via your account manager.