Many technicians use complex technical indicators such as Average True Range, but experienced ones use them in conjunction with basic indicators such as volume and long-term simple moving averages. Arguably the most important of trend-following indicators is the Simple Moving Average, and the gold standard of moving averages is the two-hundred-day simple moving average. This is because it gives a simple, mathematically objective answer to the question all traders and analysts need to know: What is the market's long-term trend?
Because of the prevalence of the two-hundred-day simple moving average, it tends to act as support in bull markets and resistance during bear markets. Perhaps more importantly, a close which breaks the two-hundred-day simple moving average sometimes marks an intermediate to long-term change in trend (as shown in the Cash US Dollar-Japanese Yen chart below).
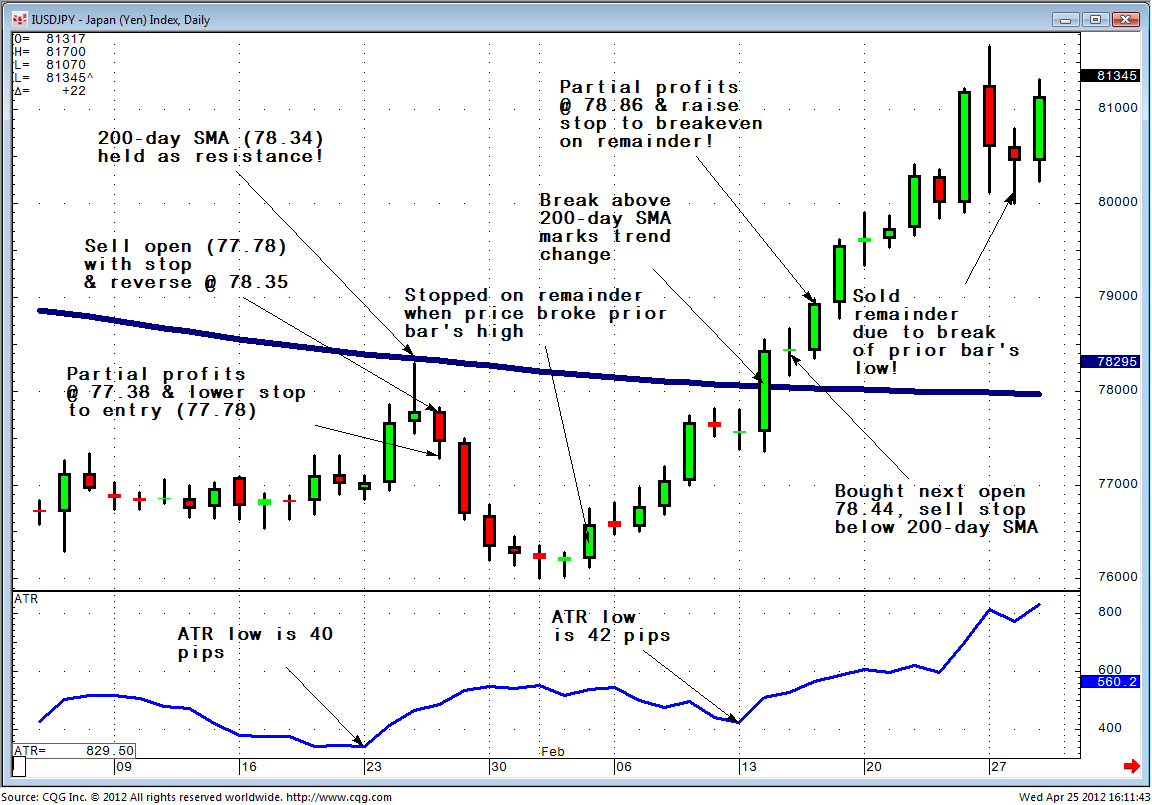
Consequently, low-risk, high-reward, high-probability setups tend to occur when we enter trend-following positions near the two-hundred-day simple moving average (unless it breaks prior to settlement) and place stop and reverse orders if the market breaks this technical level. Of course, we will need to superimpose some type of criteria for exiting onto this entry setup. As shown in our US Dollar-Japanese Yen chart, I favor partial profit taking on positions that enjoy a statistically significant unrealized profit as defined by the asset's ten-day ATR low. I also favor using trailing stops set to the prior day's high (for short positions) or prior day's low (for long positions). Using this method, we simultaneously prevent a statistically-significant unrealized gain from turning into a statistically-significant realized loss while taking partial profits and allowing our winners to "run."