The dollar index moved higher by 1.05% in the fourth quarter of 2018, and the commodities asset class posted a loss over the final three months of the year that ended on December 31. Two of the six major sectors posted losses while four moved to the upside. However, the extent of losses was more significant than gains in the world of commodities. The composite of 29 raw material markets that trade in the U.S. and U.K. gained 7.95% in 2017. In Q4, commodities lost 2.85% and were down 6.82% in 2018.
Energy led the way on the downside in Q4
During the period from October 1 through December 31, 2018, the energy sector was the big loser in the commodities asset class, posting a 23.75% loss. WTI and Brent Crude oil lost 38% and 34.93% respectively. Gasoline fell by 37.57% while heating oil dropped 28.49%. Ethanol, the biofuel reached a new record low during the final three months of the year and lost 1.25% over the three-month period. Even natural gas which exploded higher in November and traded to its highest price since 2014 settled Q4 with a loss of 2.26%.
The other sector that posted a loss was base metals which fell by 4.65% for the three-month period. LME nickel posed a double-digit loss on a percentage basis for the second consecutive quarter.
The worst performing commodity was another NYMEX crude oil. The price of WTI fell by just over 38% in Q4 and was 24.84% lower on the year.
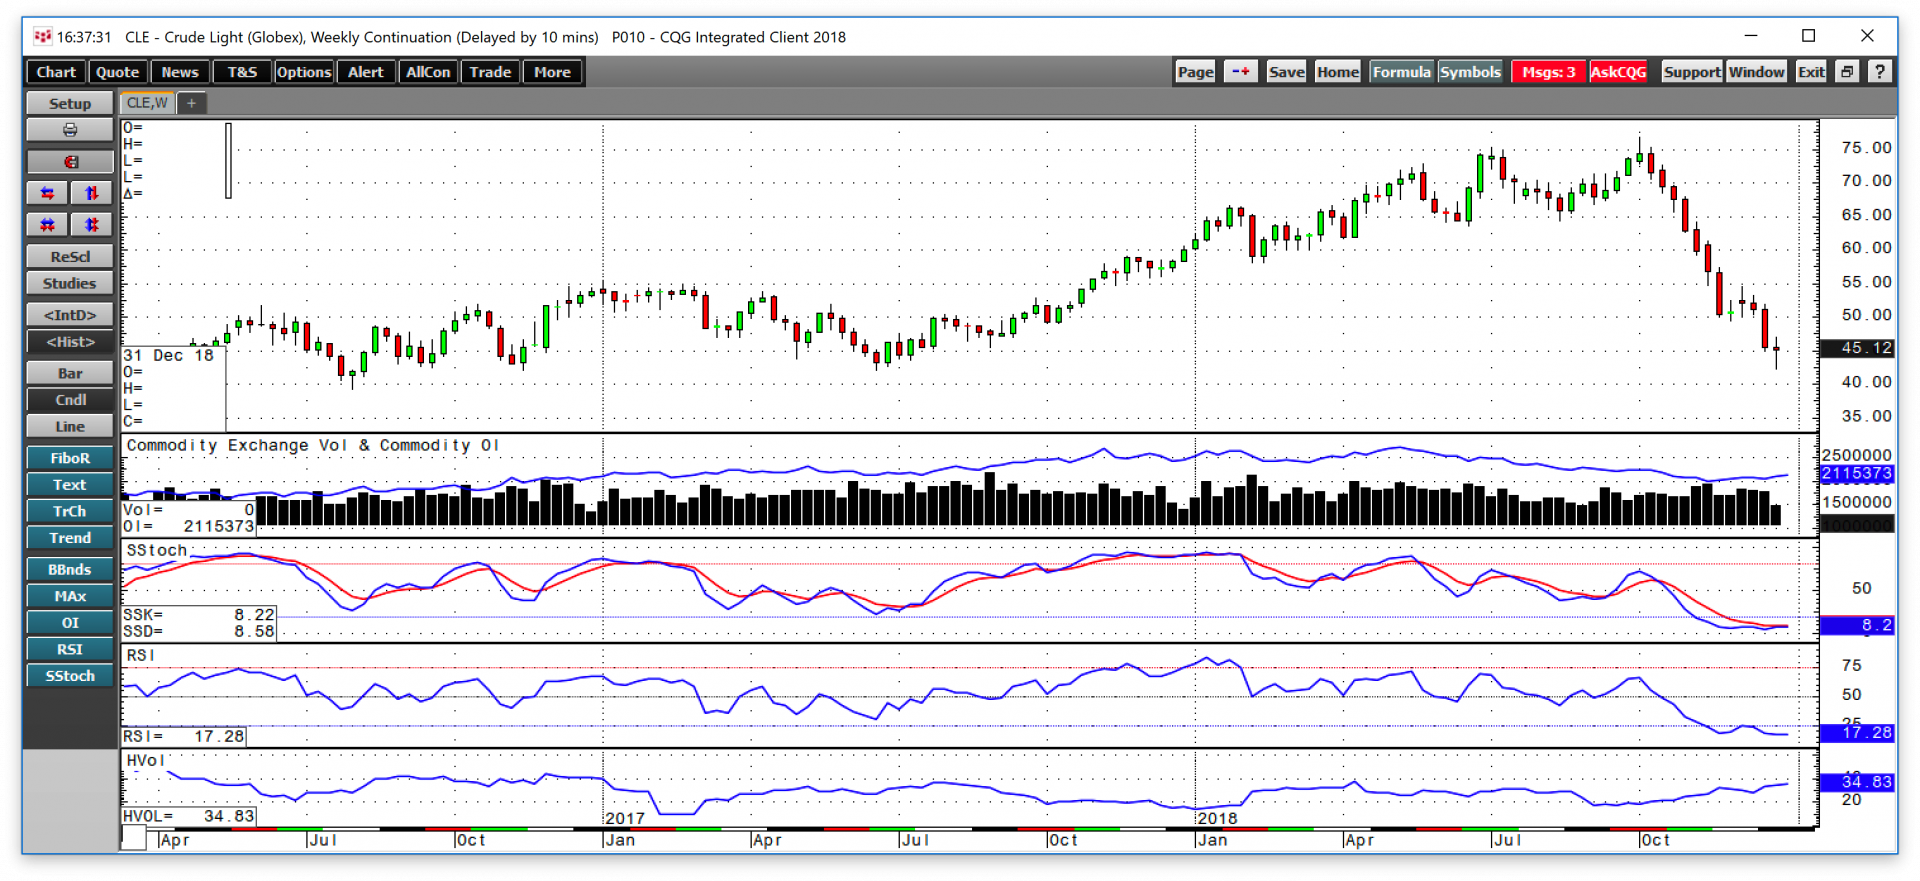
As the weekly chart shows, crude oil futures fell from a high at $76.90 on October 3 to settle Q4 at $45.41 per barrel despite a 1.2 million barrel per day production cut by OPEC. Crude oil traded to a low at $42.36 per barrel which was just 21 cents above the June 2017 low and area of technical support at $42.05 per barrel.
Production in the United States rose to 11.7 million barrels per day, which weighed on the price along with a strong dollar, the ongoing trade dispute with China, and U.S. pressure on the Saudis to sell, and exemptions to countries that purchase the energy commodity from Iran as sanctions took effect in November. The oil market had become overly long on the back of the sanctions, and the exemptions and Saudi selling caused the bottom to give way in the oil market. Open interest declined from 2.245 million contracts at the end of Q3 to 2.115 million at the end of Q4, a drop of 5.8%. Weekly historical volatility moved from 18.77% to 34.83% over the period as the oil market took the elevator to the downside.
Other notable declines in the commodities markets came in gasoline which dropped 37.57% in Q4, Brent crude oil which lost 34.93%, heating oil fell 28.49%, and LME nickel forwards which were 15.10% lower over the period and FCOJ which fell by 15.21%. Raw materials that shed between 5-10% of their value were aluminum which was 9.2% lower, COMEX copper which lost 6.31%, cotton which lost 5.94% of its value, and feeder cattle with a 5.90% loss.
Those commodities that lost 3% to 5% include KCBT wheat which declined 4.40%, MGE wheat which moved 4.10% to the downside, soybean oil futures that fell 3.94%, lumber that was 3.46% lower, zinc which fell 3.39%, and LME copper which lost 3.20%. Smaller losses of 0-3% occurred in platinum which lost 2.78%; natural gas dropped 2.26%, lean hogs posted a 1.93% loss, while ethanol fell 1.25%. CBOT wheat declined 1.13%, and coffee moved 0.59% lower over the final three months of 2018.
Gasoline and heating oil processing spreads reflected seasonal factors as we moved in the winter season in Q4, but both declined. Gasoline cracks moved 34.92% lower, and heating oil cracks which are a proxy for distillate products posted a 0.71% loss at the end of the fourth quarter compared to their closing prices at the end of Q3.
The CFTC has defined digital currencies as commodities. The cryptocurrency asset class that was all the rage in 2017 continued lower over the past three months, but Bitcoin broke down and posted a 43.94% loss. Bitcoin lost 74.36% of its value in 2018. All of the other of the digital currencies posted losses over Q4. The market cap of the asset class as a whole moved from $220.948 billion to $125.175 billion, down 43.35% for the three-month period as Bitcoin slightly underperformed the other tokens in the final three months of 2018. Ethereum which posted a 40.02% loss in Q4 and lost 82.31% of its value on the year.
Cocoa, Sugar, Palladium were double-digit winners
In Q4, precious metals led the commodities asset class with a 5.49% grain followed by grains that were 3.14% higher and soft commodities which moved 2.23% to the upside. The meats posted a marginal 0.45% gain over the final quarter of 2018.
The individual markets that were leaders were cocoa that exploded by 17.46% in Q4, sugar which was 15.45% higher, and palladium which gained 11.60%. Commodities that moved between 5% and 10% to the upside include live cattle which gained 9.19%, gold that moved 7.54% higher, silver which was up 5.63%, and corn added 5.26% over the final three months of the year. The commodities that were 3% to 5% higher were soybeans up 4.38%; oats gained 3.97% and rice which rallied by 3.22% in Q4.
Marginal increases of 0-3% occurred in the tin market which moved 2.91% to the upside, iron ore which gained 0.68%, soybean meal up 0.28%, and LME lead which posted only a 0.10% gain.
The big winner in Q4 was cocoa
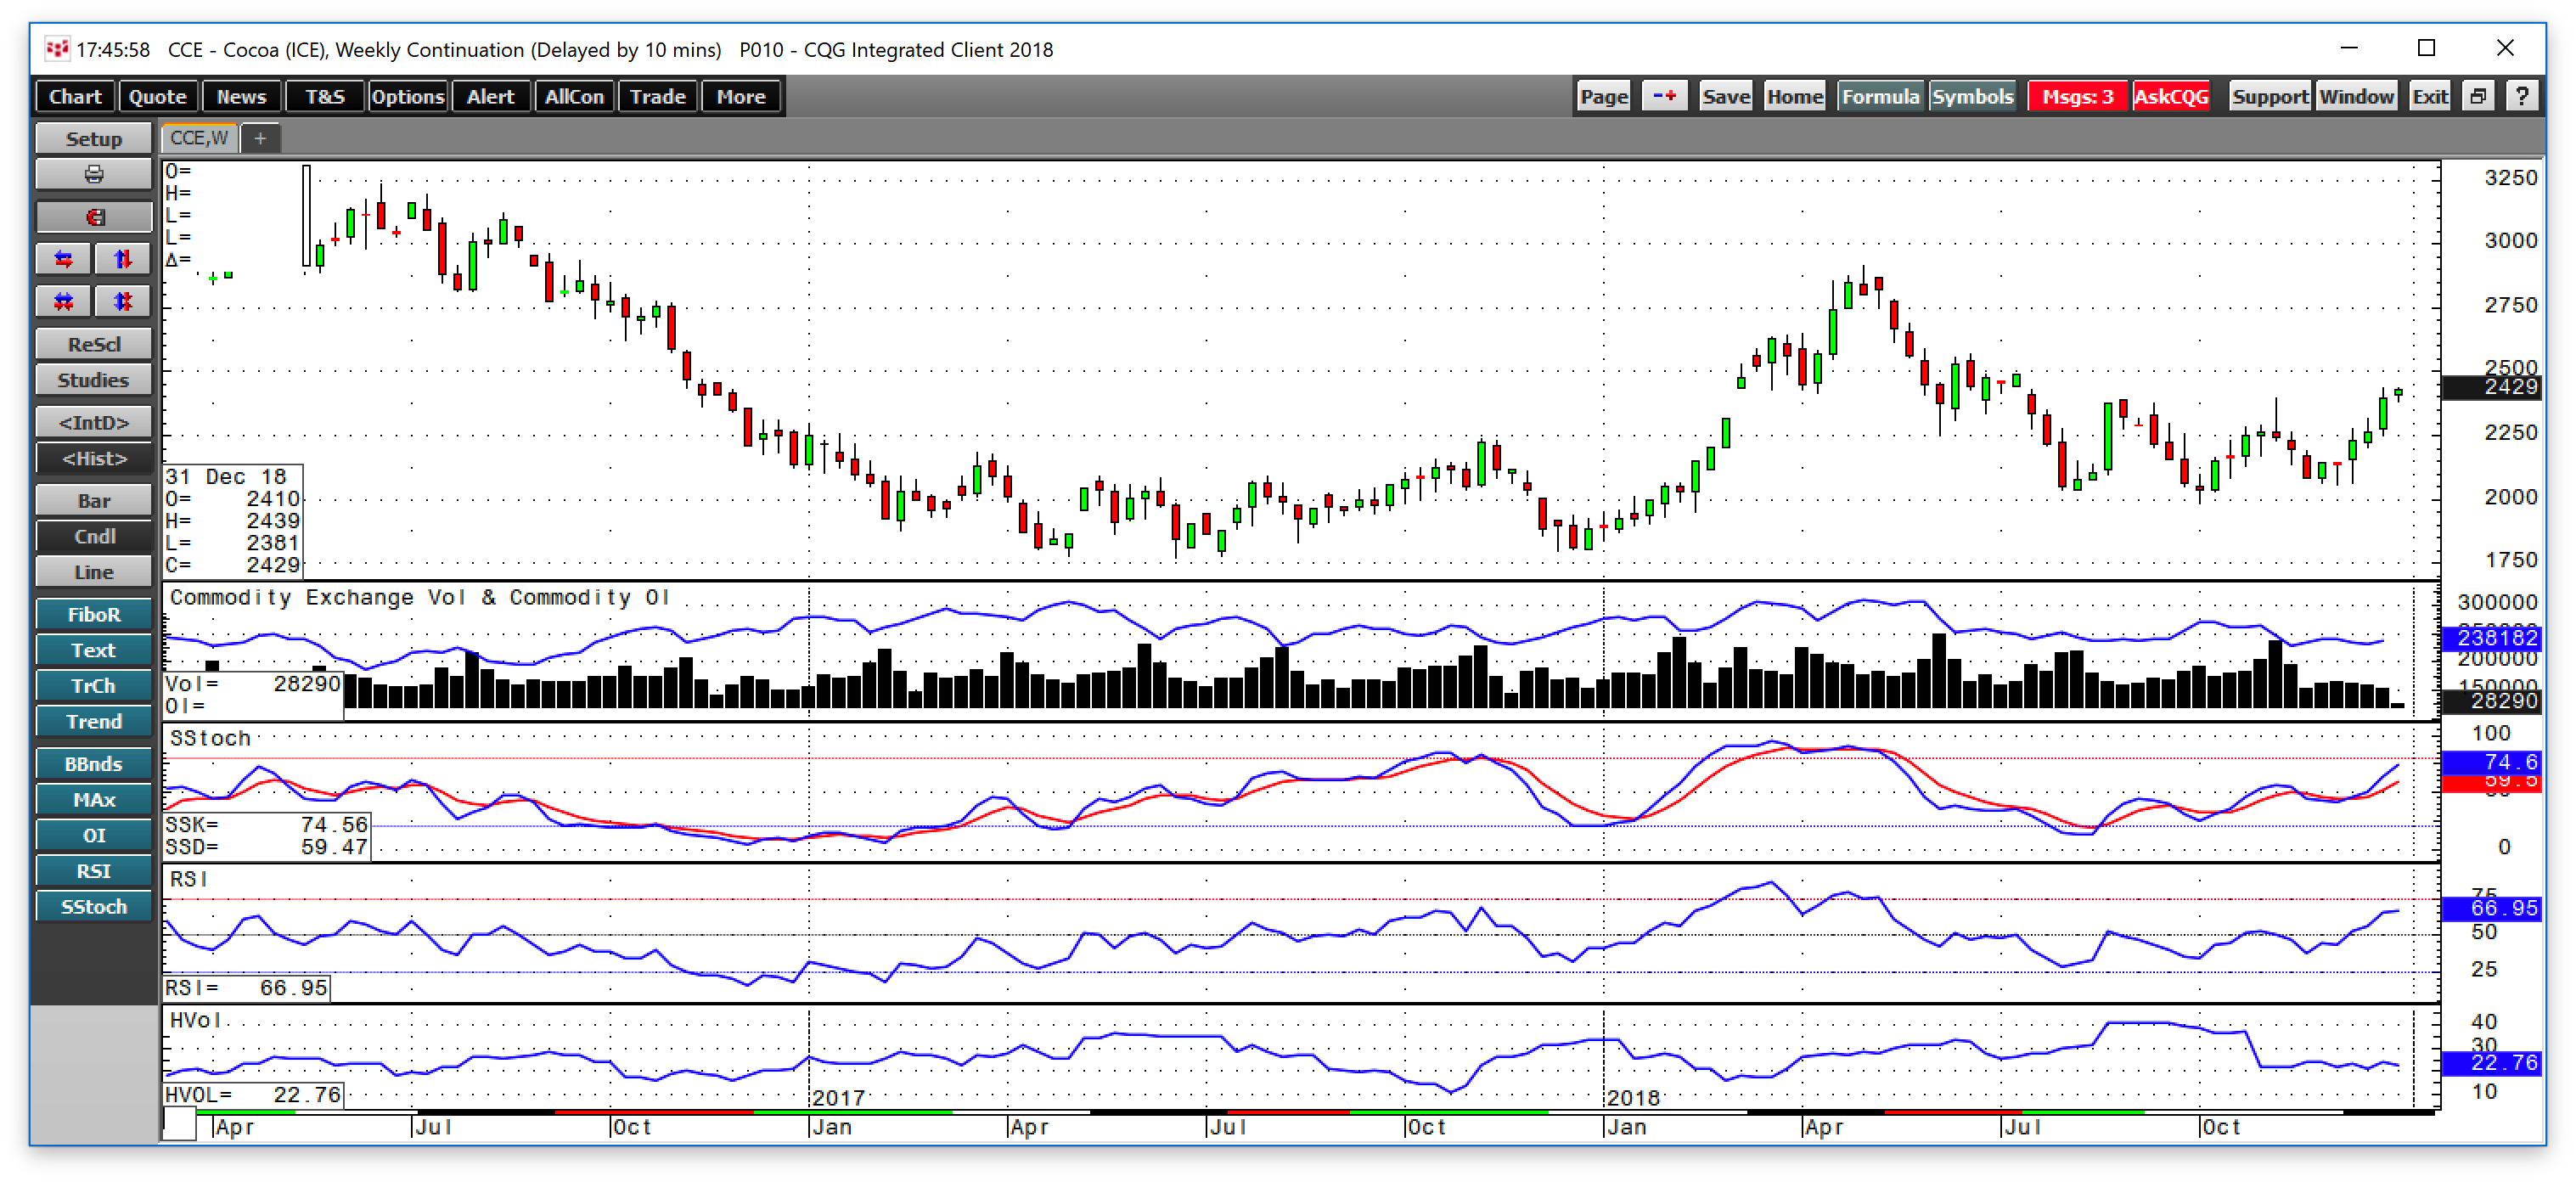
As the weekly chart highlights, ICE cocoa futures rose to a high of $2439 at the end of Q4 and settled at $2416 above the technical resistance area at the $2400 level. Cocoa had been trading in a $2000-$2400 range, and the break to the upside added almost 17.5% to the price in Q4 and was the biggest gainer for 2018 with a 27.7% increase compared to its closing price at the end of 2017.
Q4 Highlights – Commodities end on a risk-off note
The Fed hiked rates by 25 basis points at their December meeting in a sea of controversy, which put the Fed Funds rate at 2.25-2.50% at the end of 2018. The Fed has continued their program of quantitative tightening as the legacy of QE rolls off the central bank’s balance sheet, which continues to put upward pressure on interest rates in the medium and long end of the yield curve in the United States.
The Fed told markets they are likely to increase the Fed Funds rate by 25 basis points twice in 2019 and that the program of QT will continue to reduce their balance sheet.
Stocks tanked at the end of the year, and the leading indices posted losses for the quarter and 2018. The VIX index which hovered around 10 in 2017, closed Q4 at 25.42, up 13.30 compared to its close at the end of Q3. As we head into 2019, the danger of a high period of volatility continues to grip markets as rates are rising and the trade dispute between the U.S. and China remains an issue. Commodities are on the front lines when it comes to tariffs and retaliatory measures as duties and subsidies distort raw materials prices.
The dollar was up and commodities prices, as an asset class, fell in Q4 and 2018. A myriad of complex factors will contribute to the price direction for the commodities market over the coming three months as we head into 2019, but we ended the year in a risk-off environment which is not a good omen for the coming year.
Prospects for Q1 2019 – Cash is King or Opportunity?
We are heading into 2019 on a sour note for investors, but markets have been sweet for nimble traders with discipline and their fingers on the pulse of markets. Investors are likely to view cash or gold as the safest assets in the current environment. Traders will continue to enjoy the wide price variance. Given the many issues that face the U.S. and the world on both the economic and political landscapes, the volatility that gripped markets in Q4 seems almost certain to continue into 2019.
Happy New Year and all the best for 2019!