Gold has a long history as a currency. The yellow metal has been a store of value for thousands of years. Gold is both a financial and an industrial commodity. Central banks around the world hold the yellow metal as part of their foreign currency reserves. Over recent years, they have been net buyers of gold with Russia and China leading the way. Both nations are significant producers and have been vacuuming their domestic output into reserves while also buying at times in the international market.
Until June, gold had traded in a $331.30 range since 2014. In the aftermath of the June meeting of the US central bank, the price broke out to the upside. The prospects for lower US rates lit a bullish fuse under the gold market which rallied past the $1400 per ounce level. In the aftermath of the Fed meeting on the final day of July, the price of the yellow metal backed off to the $1415 level.
Gold breaks to the upside in June
When the US Federal reserve told markets that short-term interest rates in the United States would head lower before the end of 2019 in June, the price of gold broke to the upside.
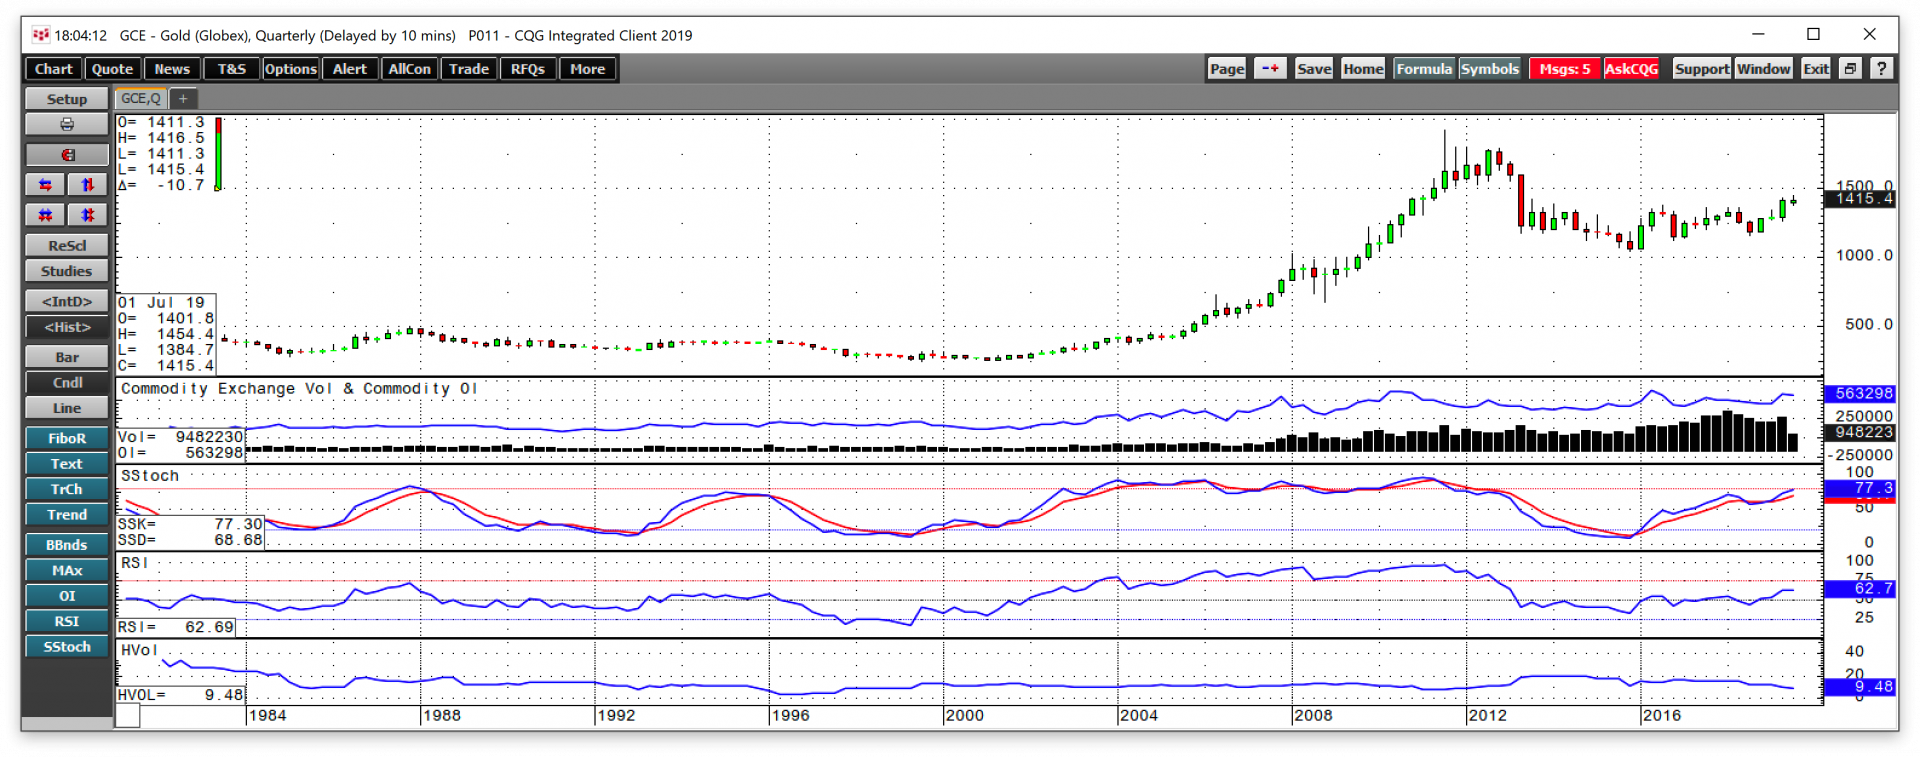
The long-term quarterly chart highlights that gold moved above its level of critical technical resistance at the 2016 high at $1377.50 on June. Open interest, the total number of open long and short positions in the gold futures market, moved higher with the price of the yellow metal. In a futures market, a rise in price alongside increasing open interest is typically a bullish sign. While the slow stochastic is in overbought territory, it continues to rise. The metric remained in an overbought condition from 2004 through 2011 as gold rose to its all-time peak at $1920.70 per ounce. Therefore, the price momentum indicator could be a sign of more gains on the horizon as it continues to rise. The relative strength indicator is also moving to the upside, but at 62.7, it has yet to increase to overbought territory. From 2004 through 2011 it was higher than the current level. Finally, quarterly historical volatility at 9.48% is below the level for the seven years that led to the 2011 high. The long-term chart provides no signals that the gold market is anywhere near overheating at $1415 per ounce at the end of July.
Price consolidation above the new area of technical support
Gold broke to the upside during the week of June 20, and it flew through the resistance level.
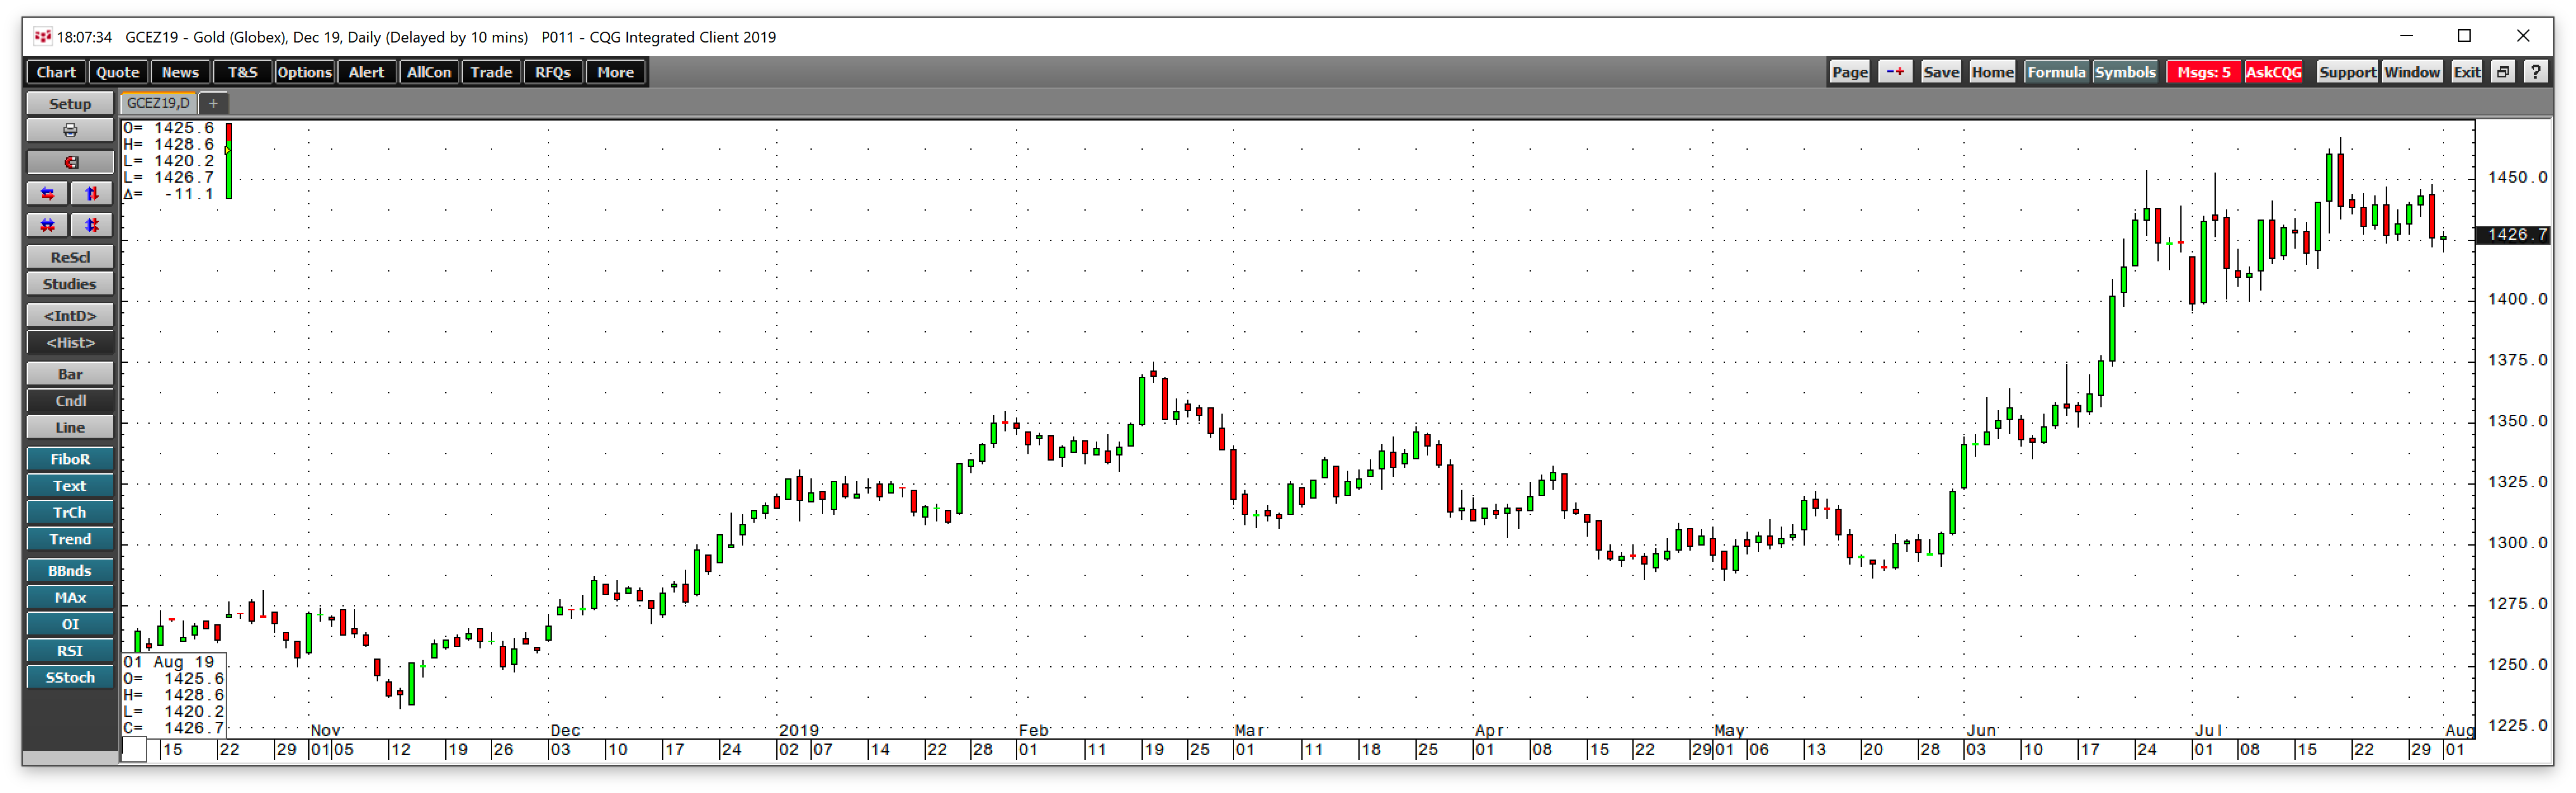
The daily chart illustrates that the initial rally took the December gold futures contract to a high at $1453.70 on June 25. After a correction to a low at $1396.40 on July 1, gold made a lower peak at $1452.60 which led to another dip to the $1399.80 level on July 9. Since then, gold has remained above $1400 per ounce and put in a new high at $1467 on July 19. At the end of July, December futures were at the $1425 level. Since mid-July the now active month gold futures contract has not been below $1400 per ounce. Gold has consolidated over the past month.
Gold broke out above the long-term resistance level at $1377.50, which has become technical support. Since the day of the June Fed meeting, gold has not challenged that price on the downside even once.
Moreover, it now looks like the period from 2013 through 2019 was a prolonged consolidation in the gold market, which recently ended.

The quarterly chart shows that the bull market in gold began in 2004, reached a peak in 2011, corrected in 2012 and 2013, and consolidated from 2013 until 2019. The next leg to the upside in the gold market may have begun.
Gold rallies in euros
The US dollar is the world’s reserve currency, but central banks also hold euros as a significant part of their foreign currency reserves. Gold has not just appreciated in dollars, but also in euros.

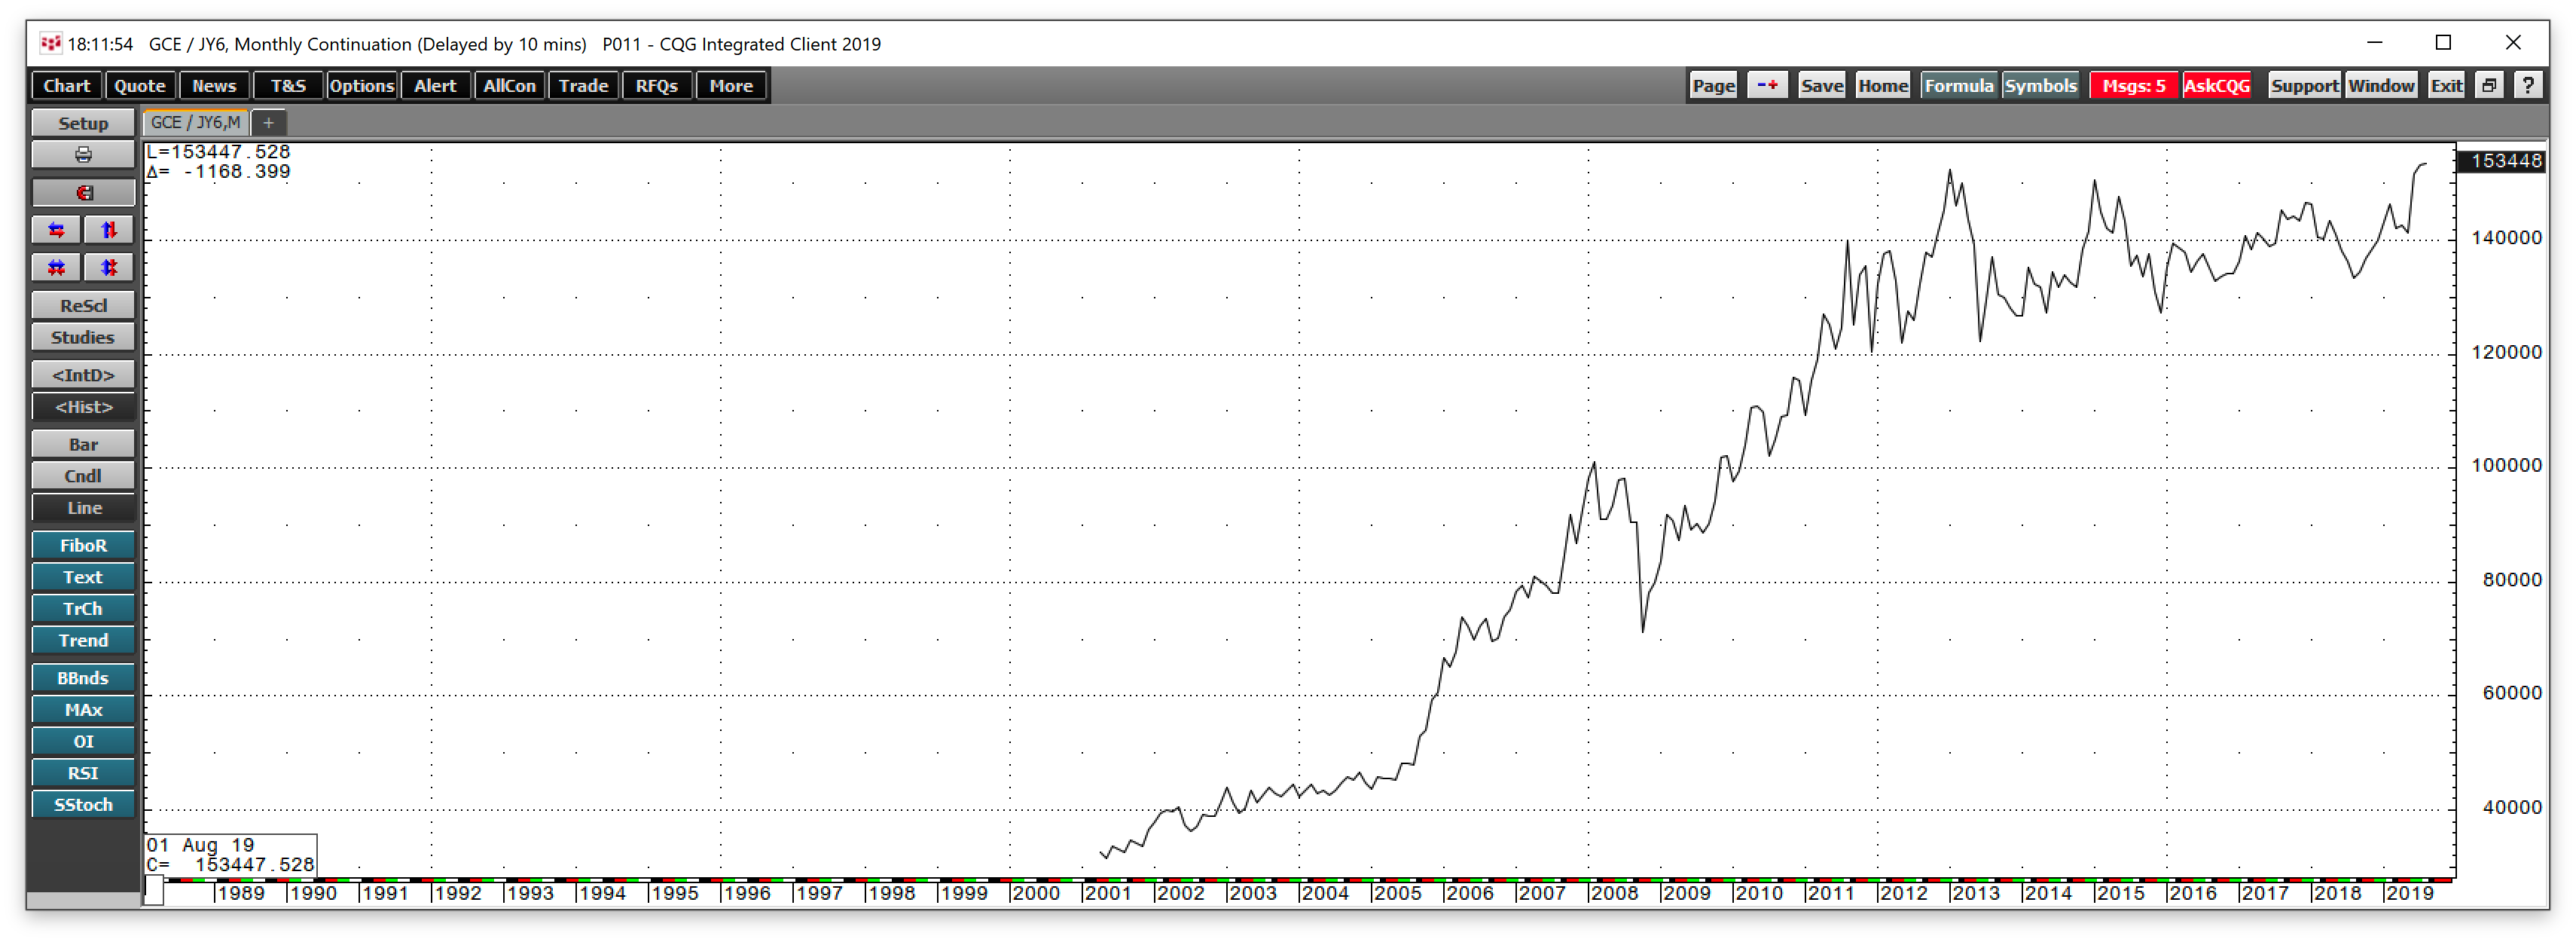
As the monthly chart displays, gold has also been in a bull market in euro currency terms since 2005. The record high in euros was at the September 2012 peak at 1376.875 euros per ounce. At 1273.20 euros per ounce, gold is closer to a new record in euros than it is in dollars.
Meanwhile, the price of gold has moved to new highs in many other currencies over the past weeks.
A new all-time high in many other currencies
In Japanese yen terms, another reserve currency, the price of gold is trading at a record level.
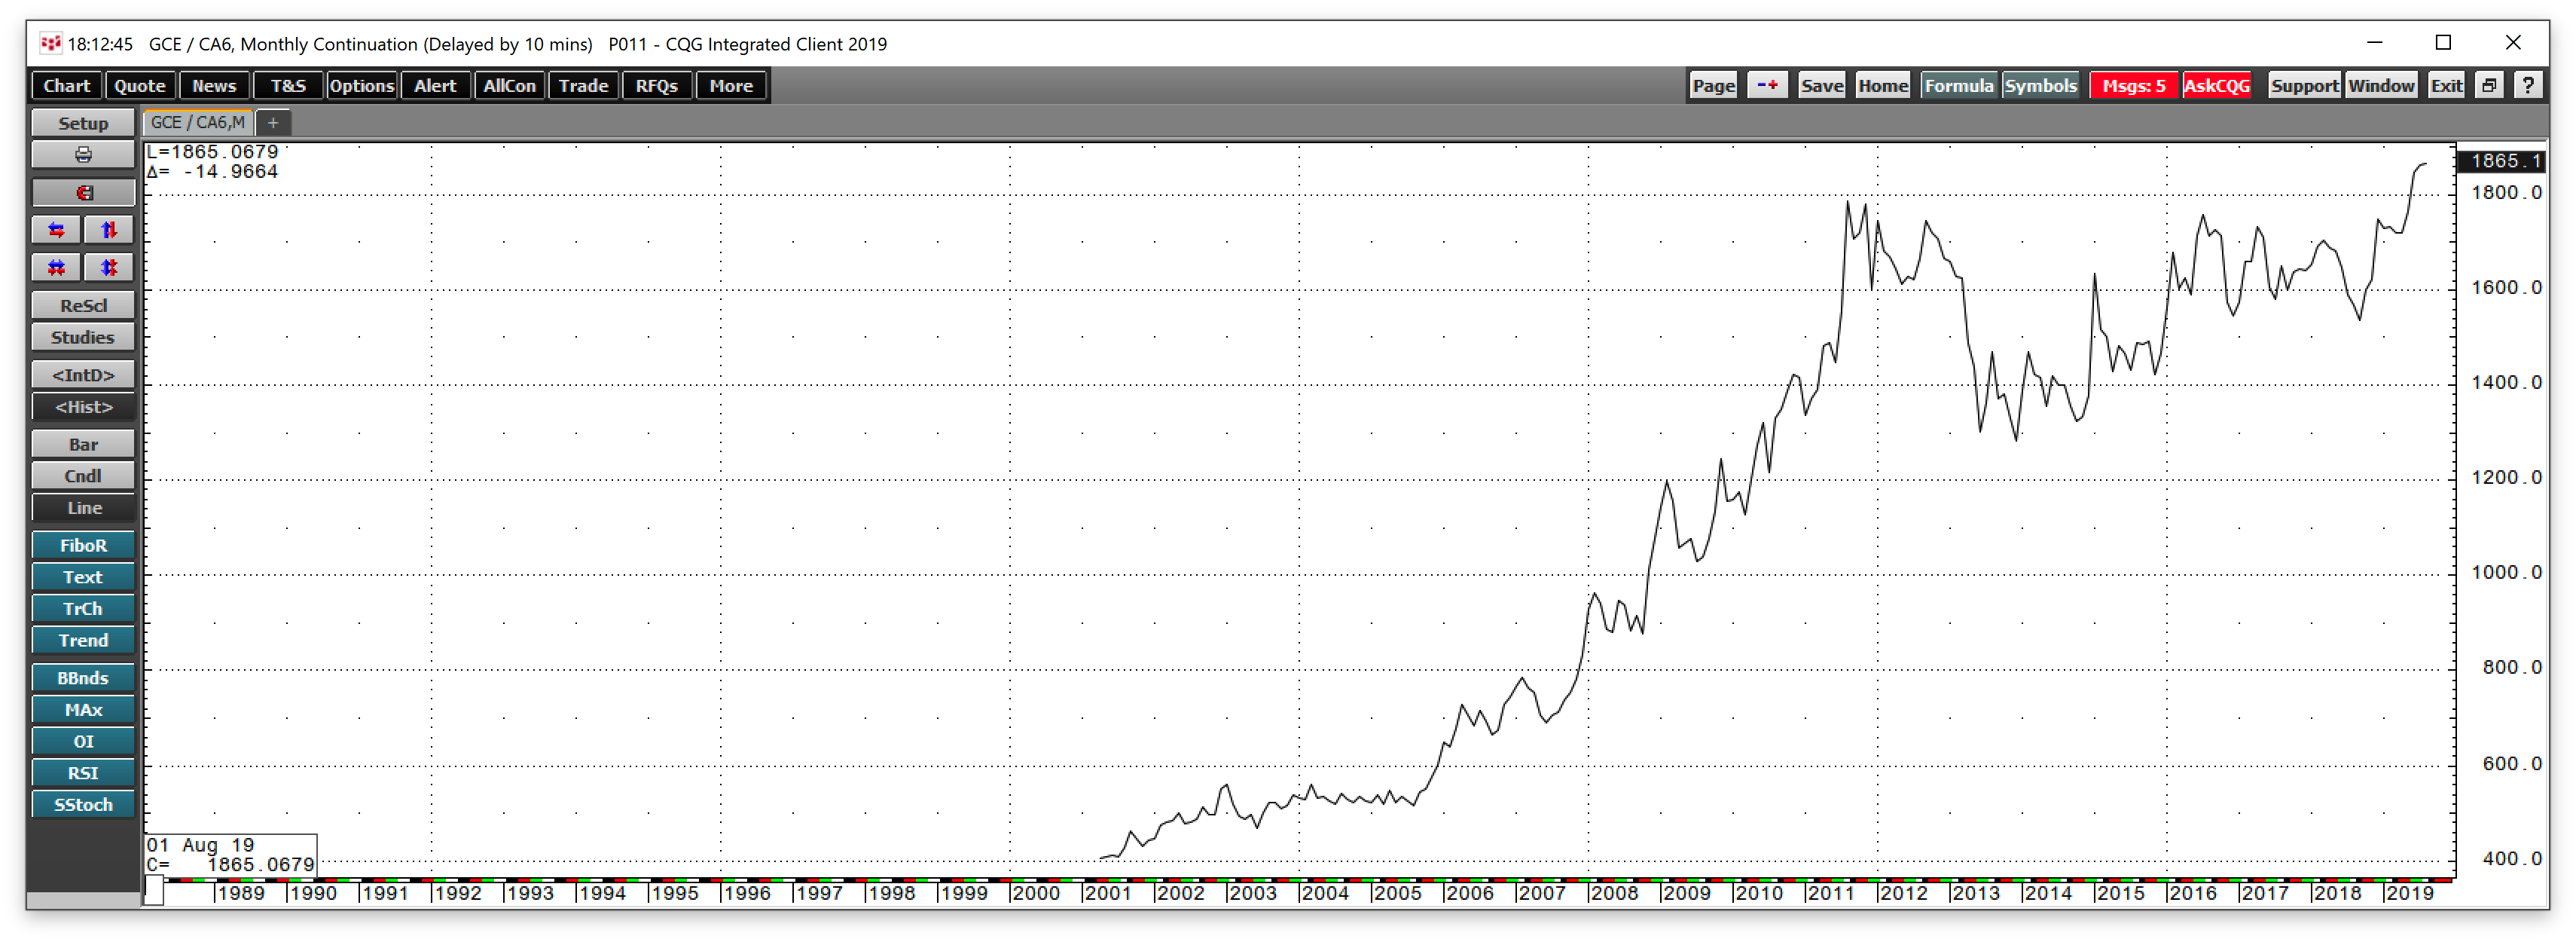
The monthly chart of gold in yen shows that at 153,448 per ounce, the price of the precious metal is now above the 2013 peak at 152,457.

At over 2060 Australian dollars per ounce, gold is at a modern-day high in the currency down under.
Gold is also at a record level in Canadian dollar terms, as well as in Chinese yuan, Russian rubles, and most other world fiat currencies.
The rise of gold in almost every foreign exchange instrument in the world is a significant event that is a commentary on the faith and credit of the nation’s that issue the various forms of legal tender.
Gold has been making a statement since the early part of this century
Analysts often watch the level of the US dollar against gold because of the yellow metals’ historical inverse relationship with the greenback. However, since 2014, the trend in gold in every currency has been bullish. With gold appreciating in all currencies, it is starting to look like the upside potential for the yellow metal is explosive. Gold has the potential to go parabolic, given its technical break. While the world’s central banks are saying that inflationary pressures are below the target 2% level, gold is signaling that they could be wrong. The yellow metal has a long history as a store of value and barometer of inflationary pressures. With gold’s purchasing power rising against currencies, it may not be too long before a similar trend develops in other commodities.
Gold is sending a signal, and if the current period of consolidation gives way to higher highs, the price could be heading for $2000 per ounce in dollar terms or higher. A runaway bull market in gold would have substantial ramifications for currencies, commodities, and markets across all asset classes.