Frequency distribution is simply how often a value appears within a group of values. For example, a group of values is a range from 1 to 5. The collection of numbers is 1, 3, 1, 2, 3, 4, 1, and 4. In this series, we see that the integer 1 occurs three times, the integer 2 occurs once, and the integers 3 and 4 occur twice. If we chart the frequency distribution as histogram bars, it looks like this:
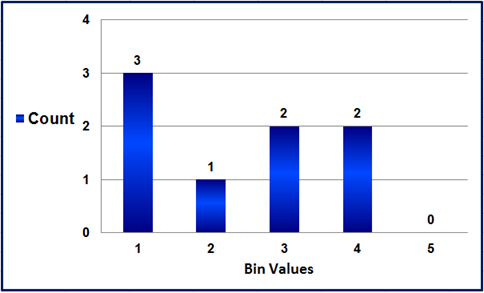
The y-axis is the number of times an integer appears in the series. The x-axis is the integers 1 through 5; it is labeled Bin Values. A bin in this case is an integer but it could also be a range. For example, in the next chart, the same data is analyzed for the number of occurrences, except this time, the bin values are a range from 1 to 2, 3 to 4, and 5 to 6. The x-axis displays the final integer in the bin range.
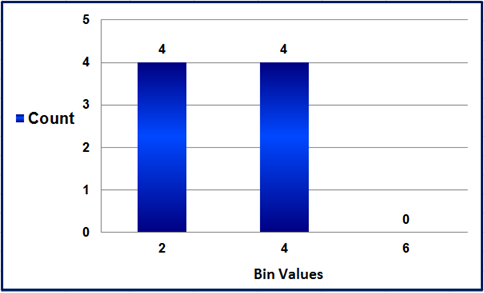
We see that for the 1 to 2 bin, there are four occurrences indicated because there are three occurrences of the integer 1 and one occurrence of the integer 2. The integers 3 and 4 each occur twice for a total of four. There are no occurrences of the integers 5 and 6.
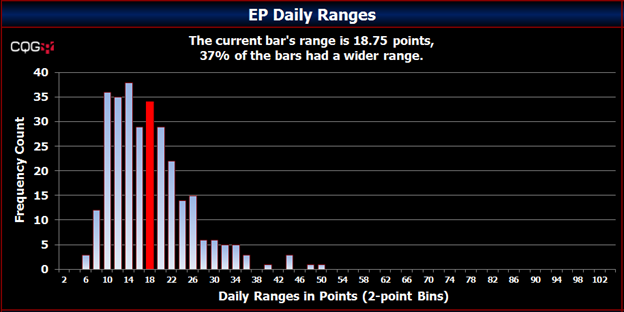
Frequency distribution analysis is helpful for determining what may be normal and what may be an extreme occurrence. For example, frequency distribution analysis can be used for analyzing a market's daily ranges. The image below shows the daily range frequency distribution for the E-mini S&P for 300 sessions. Each bin is a daily range increasing in 2-point steps, i.e., bin 6 is the sum of daily ranges between 4.25 and 6 and bin 10 is the sum of daily ranges between 8.25 and 10. The daily range was between 8.25 to 10 points just over 35 times.
The CQG Labs Market Statistics dashboard provides four frequency distribution charts that show:
- daily ranges;
- net closes;
- the difference between the previous session's close and the current session's low for sessions that closed up; and
- the difference between the previous session's close and the current session's high for sessions that closed down.