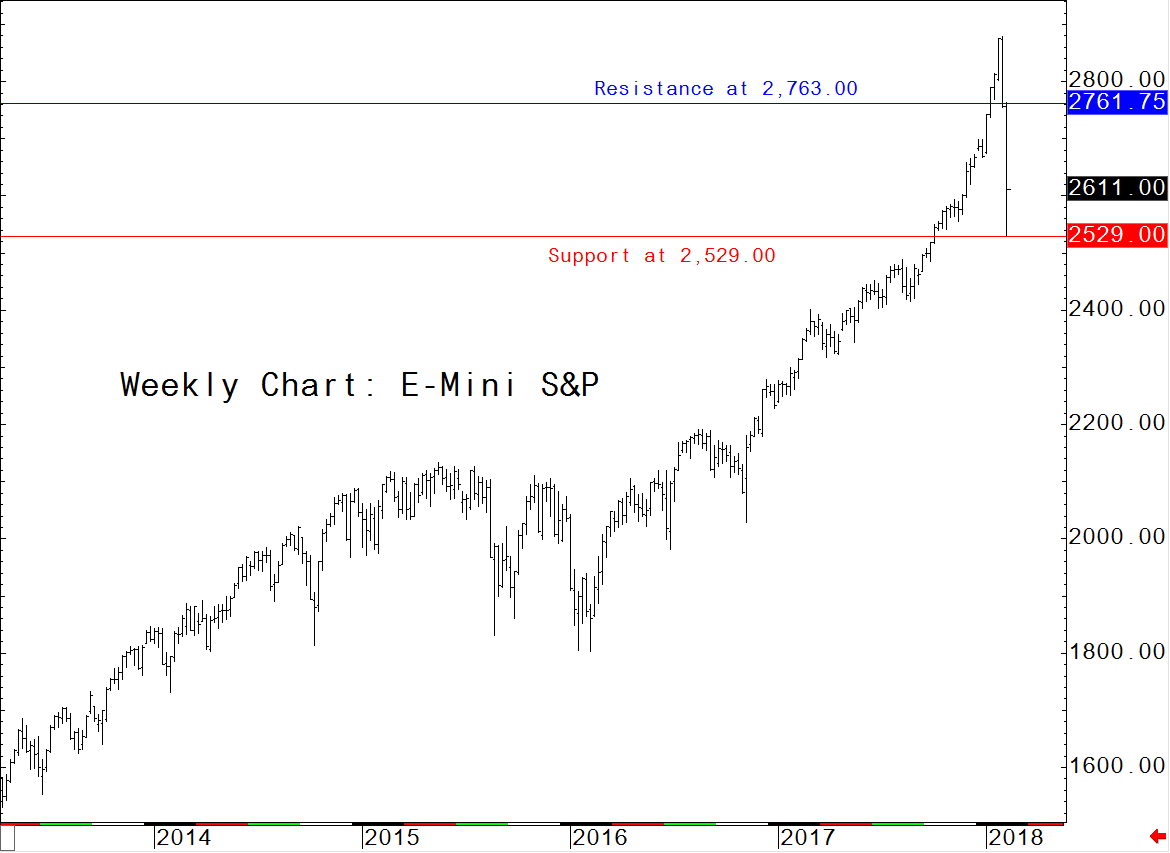
S&P 500: Major near-term technical damage has been inflicted on the U.S. stock indexes with the recent price downdraft. There is also serious longer-term chart damage occurring. See on the weekly continuation chart for nearby S&P 500 futures that price action the past couple weeks has produced a bearish “key reversal” down—whereby a new high is made and then price action dramatically reverses. Key reversals patterns are rare on weekly charts, and are very technically significant. Technical signals are mounting that a major market top is in place in the U.S. stock indexes.
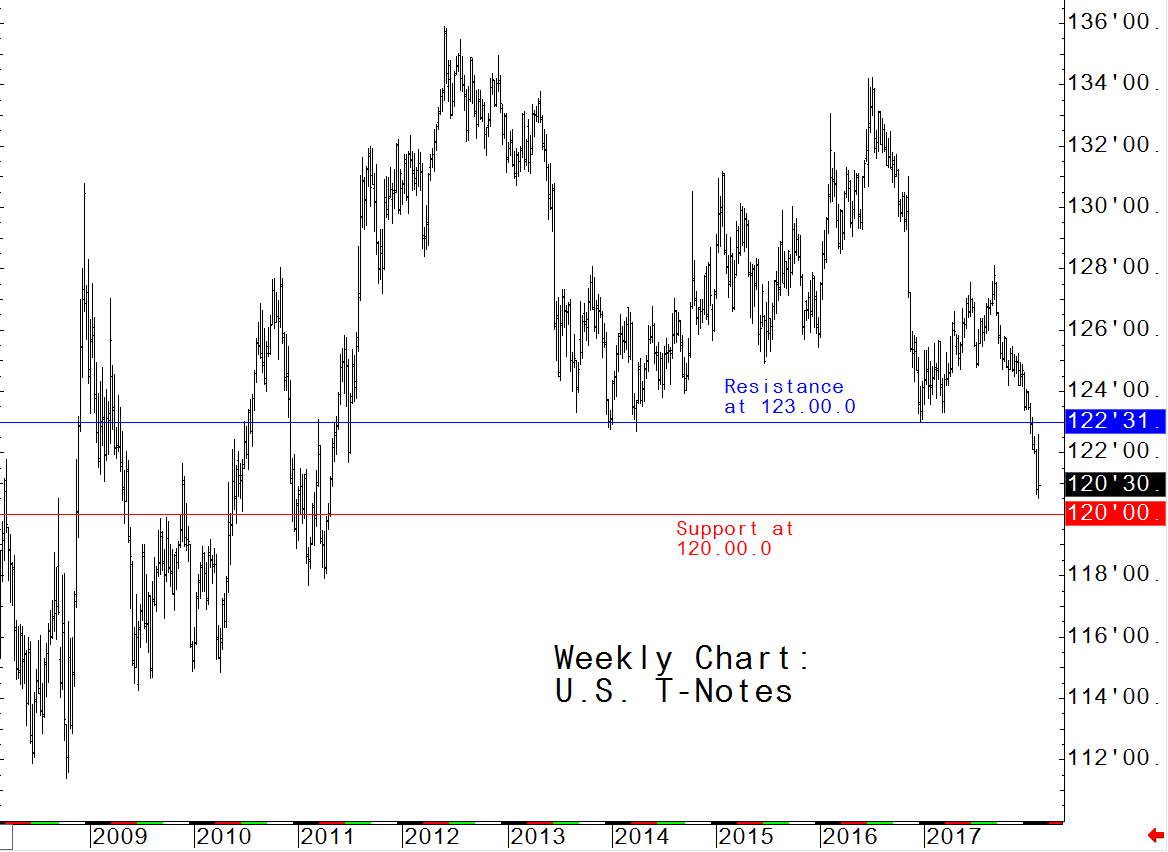
U.S. Treasury Notes: Nearby T-Note futures prices hit an 11-year low this week. Prices are in a steep downtrend on the weekly chart. This is turning into a major bear market on U.S. Treasuries, with no early clues that market bottoms are close at hand.
U.S. Dollar Index: The USDX is a basket of six major world currencies stacked up against the greenback. While the near-term technicals (daily chart) have shown prices stabilizing this week, the longer-term technical posture, as seen on the weekly chart, remains firmly bearish amid a long-term price downtrend. This weekly chart is a good example of how price trends in currency markets tend to be stronger and longer-lasting than price trends in other markets.
Nymex Crude Oil: The weekly continuation chart for nearby futures shows an uptrend still in place, but it is in jeopardy if more selling pressure occurs next week. Several daily closes below key chart support at $60.00 would be a technical clue that the oil market has topped out, and maybe for the entire year.
Silver: The weekly chart for nearby Comex silver futures shows prices trapped in a sideways trading range at historically lower levels. An upside “breakout” from the trading range would fire up the silver bulls for much bigger gains in the coming months, or longer. However, the bulls have heavy lifting to do to achieve a bullish upside breakout.
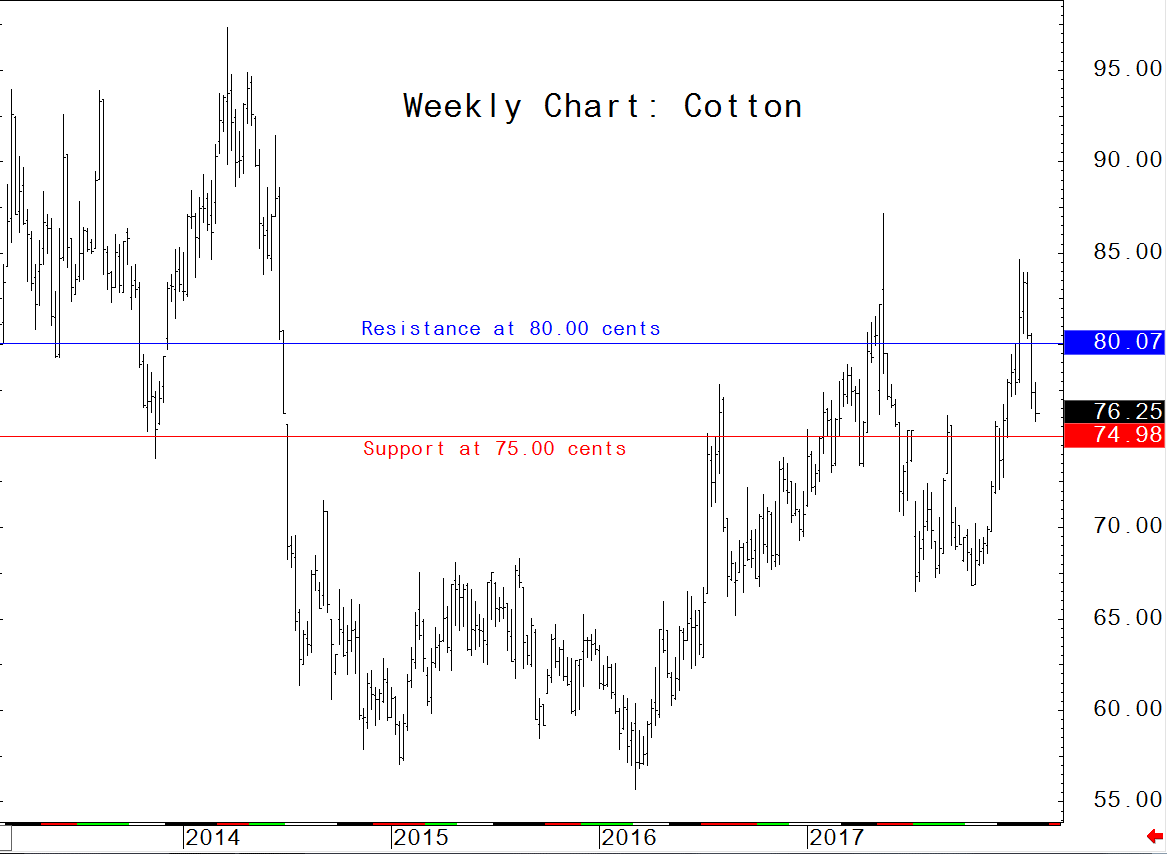
Cotton: The weekly chart shows prices have backed well down from the recent high, but the bulls still possess the longer-term technical advantage. Bulls will have to push nearby cotton futures prices back above stiff chart resistance at 80 cents to regain decent longer-term technical strength.
Grains: If the world stock markets see more selling pressure in the coming days and weeks, or longer, the monies exiting equites will be seeking a new home. Hard assets, such as raw commodities (including the grains and livestock markets) will benefit from the move out of paper assets (stocks and bonds). This is not a new or surprising phenomenon, as markets' price history shows the cyclical nature of investor and trader preferences tending to swing between hard assets and paper assets every few or more years. Another positive for the grain and livestock markets was starting to show up as the new year got under way. Markets' collective price actions to start 2018 strongly suggest the raw commodity sector has entered a cyclical upturn. The Goldman Sachs Commodity Index is a basket of raw commodity futures markets' prices rolled into one composite index. The GSCI has been trending higher since early 2016 and has just hit a more-than-three-year high. The solid price uptrend on the weekly GSCI chart suggests more gains in the index in the coming weeks and months, and even longer.
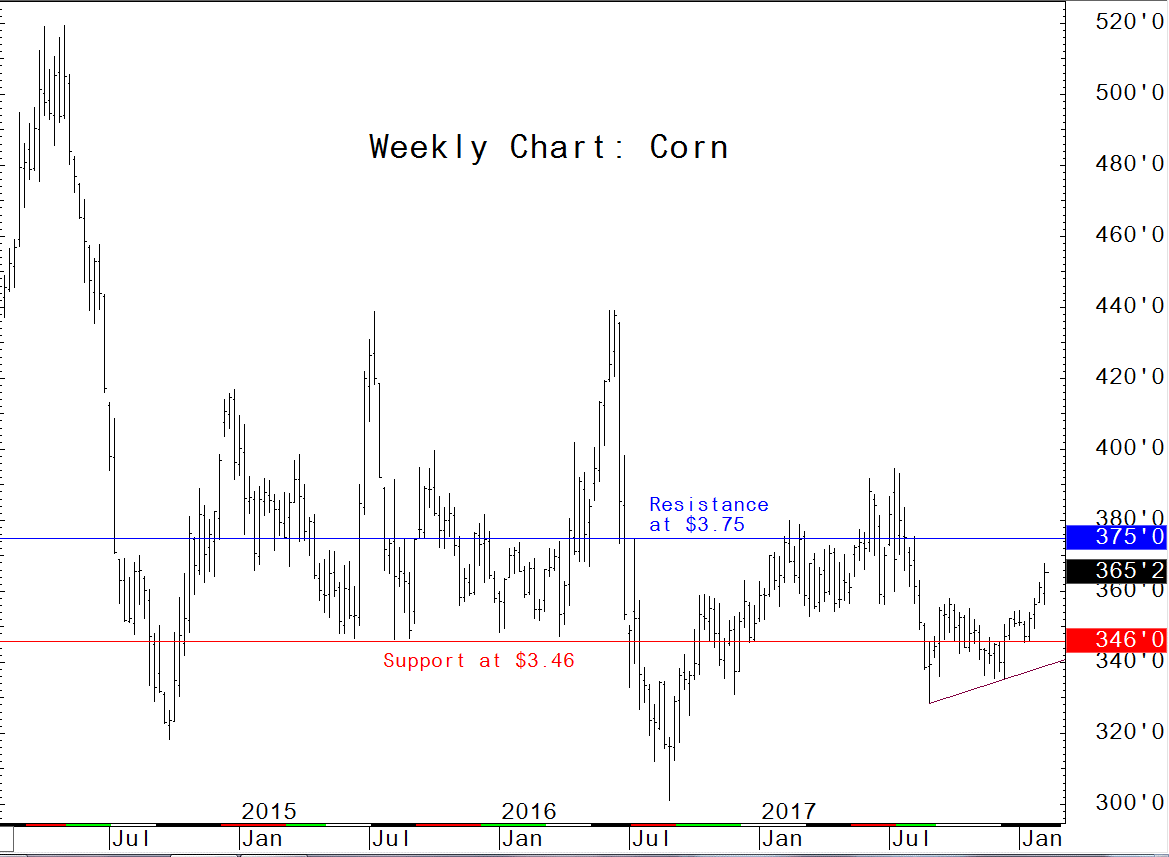
Corn: The weekly chart for corn shows a fledgling longer-term price uptrend has developed.
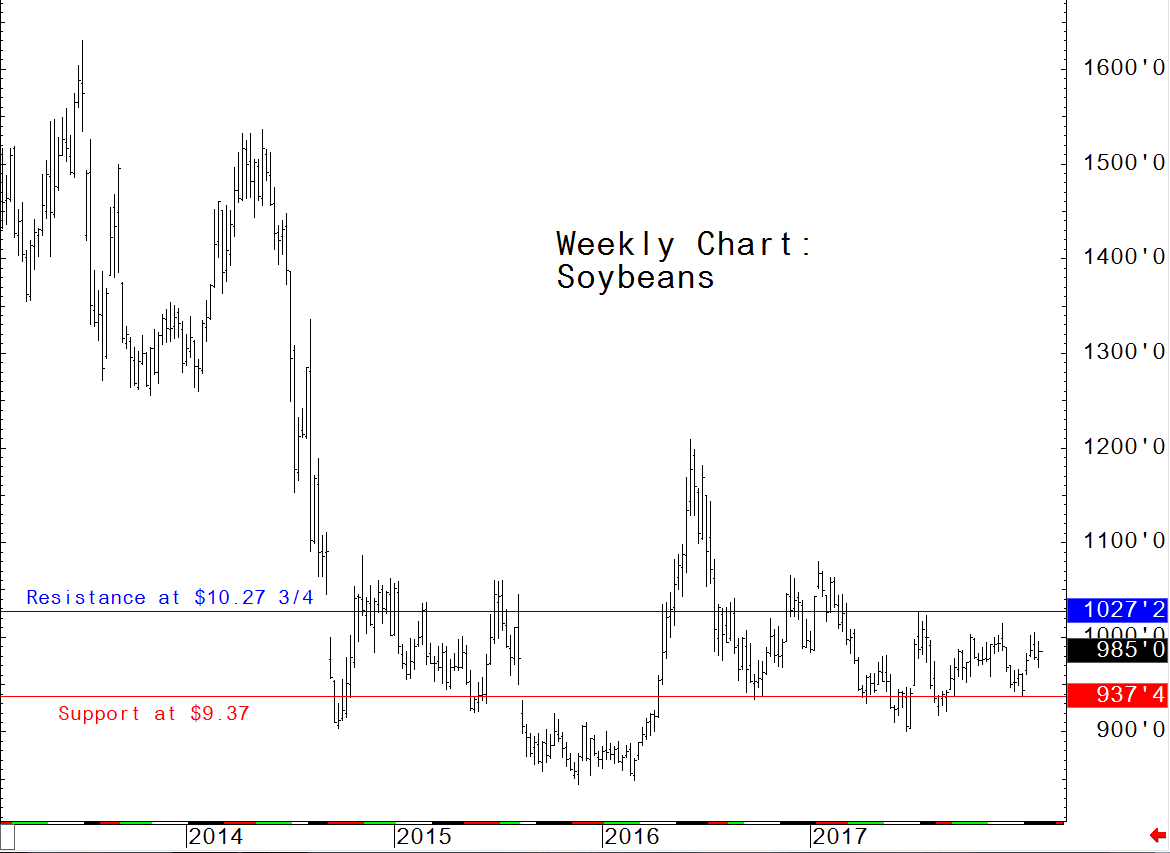
Soybeans: Prices are still trapped in a sideways trading range on the weekly chart.
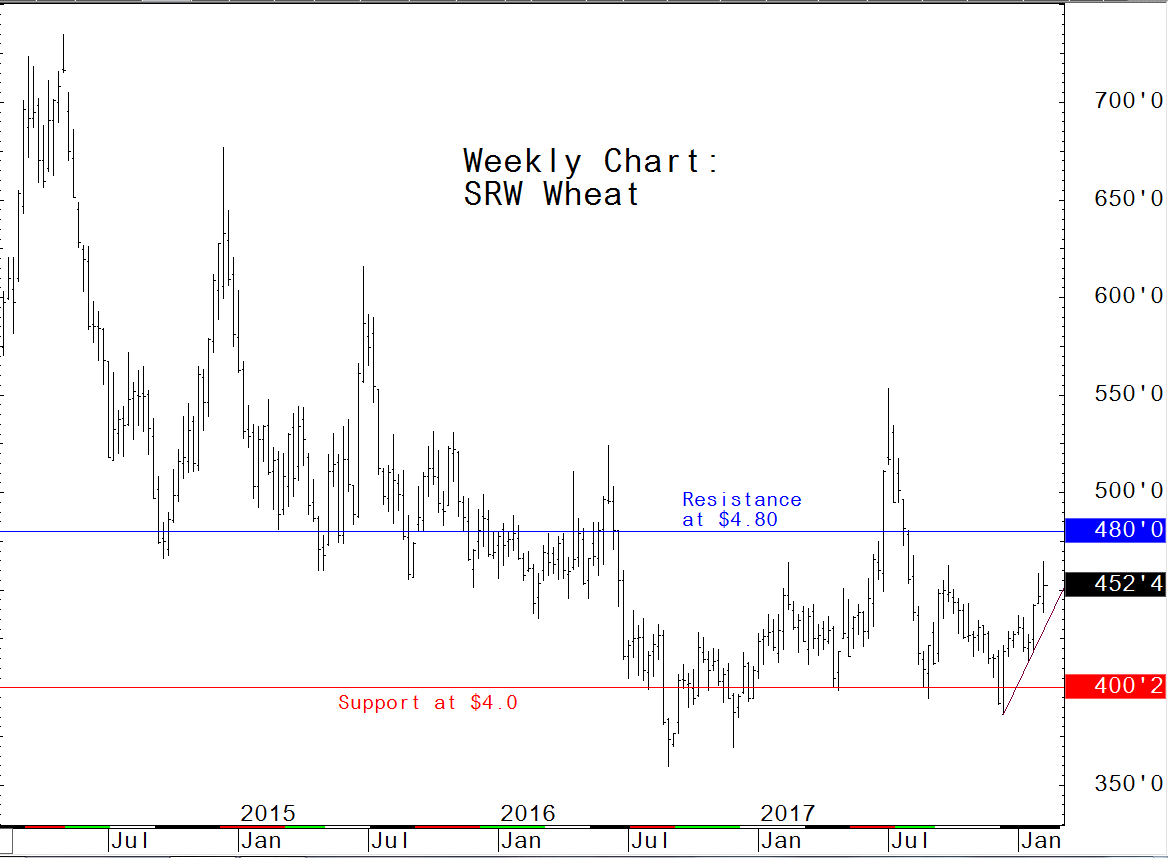
SRW Wheat: The weekly soft red winter wheat chart shows a fledgling price uptrend has developed.
Calculating Pivot Points
Many years ago, when I was a market reporter for Futures World News (now called Dow Jones Newswires) I had the job of figuring "Pivot Points" for many of the markets on which I would report. I remember it being a tedious job in my early years as a reporter--before there were computer spreadsheet programs to do the math on figuring the Pivot Points. I also remember bumping up against deadlines, hurriedly punching numbers into my small calculator, on which my big fingers many times missed their mark!
Despite my early dislike for calculating Pivot Points, those figures are a useful method for figuring near-term support and resistance levels. In fact, some traders use Pivot-Point analysis for entry and exit signals on shorter-term trades.
Floor traders, especially, like to use Pivot Points in their trading methodologies. They use the previous trading session's price data to help determine support and resistance levels, including potential entry and exit points on shorter-term trades (day trades).
Calculating Pivot Points
Here's how you calculate Pivot Points on any market. It's relatively simple.
Using previous trading session's price data:
Pivot point = High + Low + Close divided by 3.
1st support = Pivot Point x 2, minus the High
2nd support = Trading Range (High minus Low) minus Pivot Point
1st resistance = Pivot Point x 2, minus the Low
2nd resistance = Trading Range (High minus Low) + Pivot Point
There are a few slight variances to the above formula, but the above formula is "the standard" and it is the most popular method of calculating Pivot Points.
For U.S. Treasury Bond and U.S. Treasury Note futures traders, you will have to take an additional step to break down the prices all the way into 32nds only, which is extra time-consuming--unless you have that extra math programmed into a spreadsheet, such as EXCEL. For example, if the "handle" on T-Bonds is 111, then you have to take 111 x 32.
Generally, if prices are trading above the Pivot Point, it's a near-term bullish clue. Price trading below the Pivot Point means the market is in a short-term bearish posture.
That's it for now. Next time I'll examine another important topic on your road to more trading success.
Pivot Points are a custom study available in CQG Integrated Client and CQG QTrader.
