Pull historical CVB data into Microsoft Excel® using RTD formulas with this sample spreadsheet. It not only pulls open, high, low, and close values into Excel, but also a study, the Relative Strength Index.
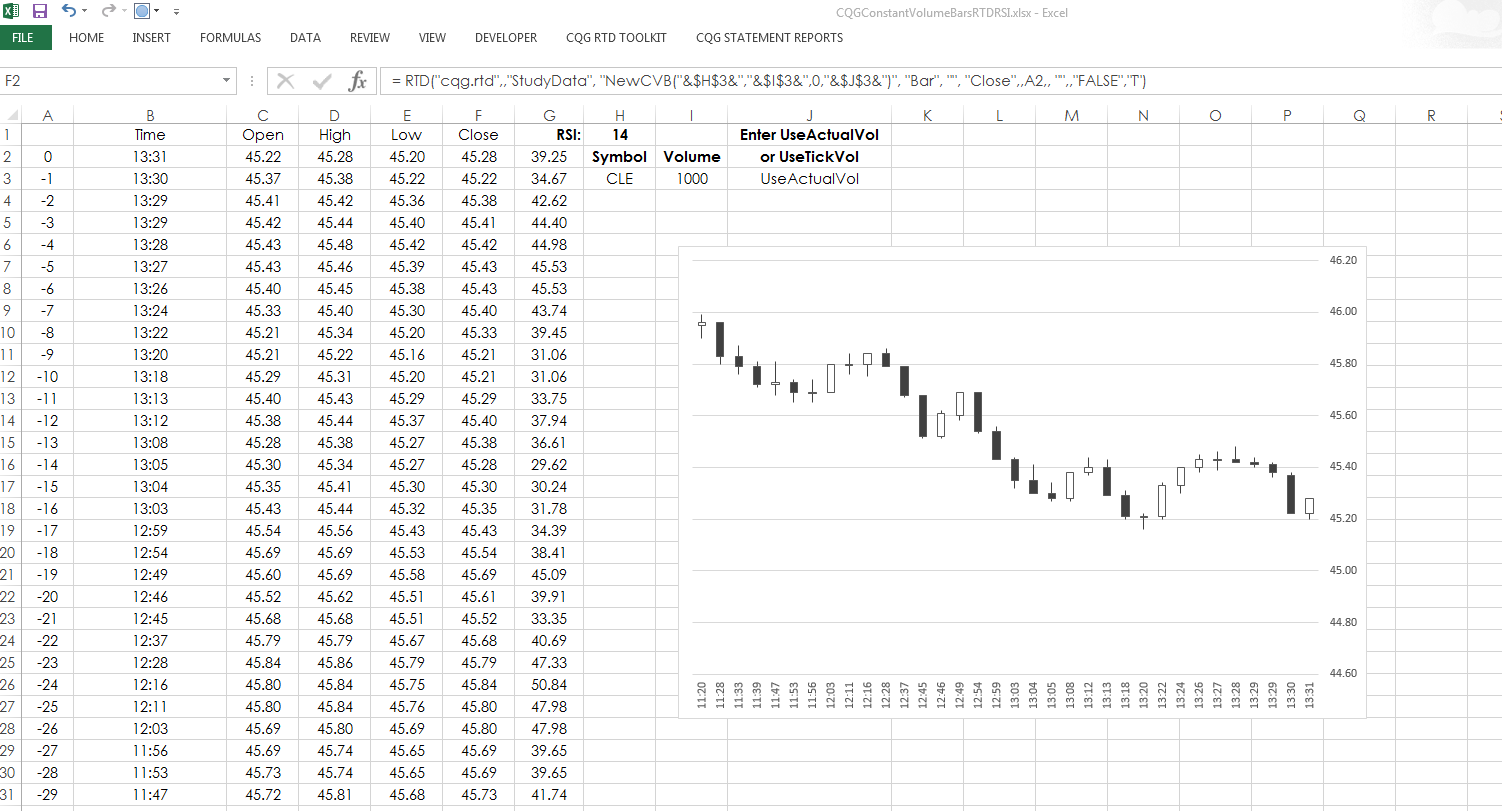
To pull in the data, we used a constant volume bar symbol:
NewCVB(CLE?1,1000,0,UseActualVol)
This symbol calls for a constant volume bar using 1,000 actual volume contracts (tick volume is the other option) building the open, high, low, and close values.
You can change the symbol, the volume level for building a new bar, including using a continuation setting, and the look-back period for the RSI.
Read more about constant volume bars
Requires CQG Integrated Client or CQG QTrader, data enablements for all symbols used in the spreadsheet, and Excel 2010 or higher.