This Microsoft Excel® dashboard pulls in the Eurodollar market data traded on the CME Globex platform.
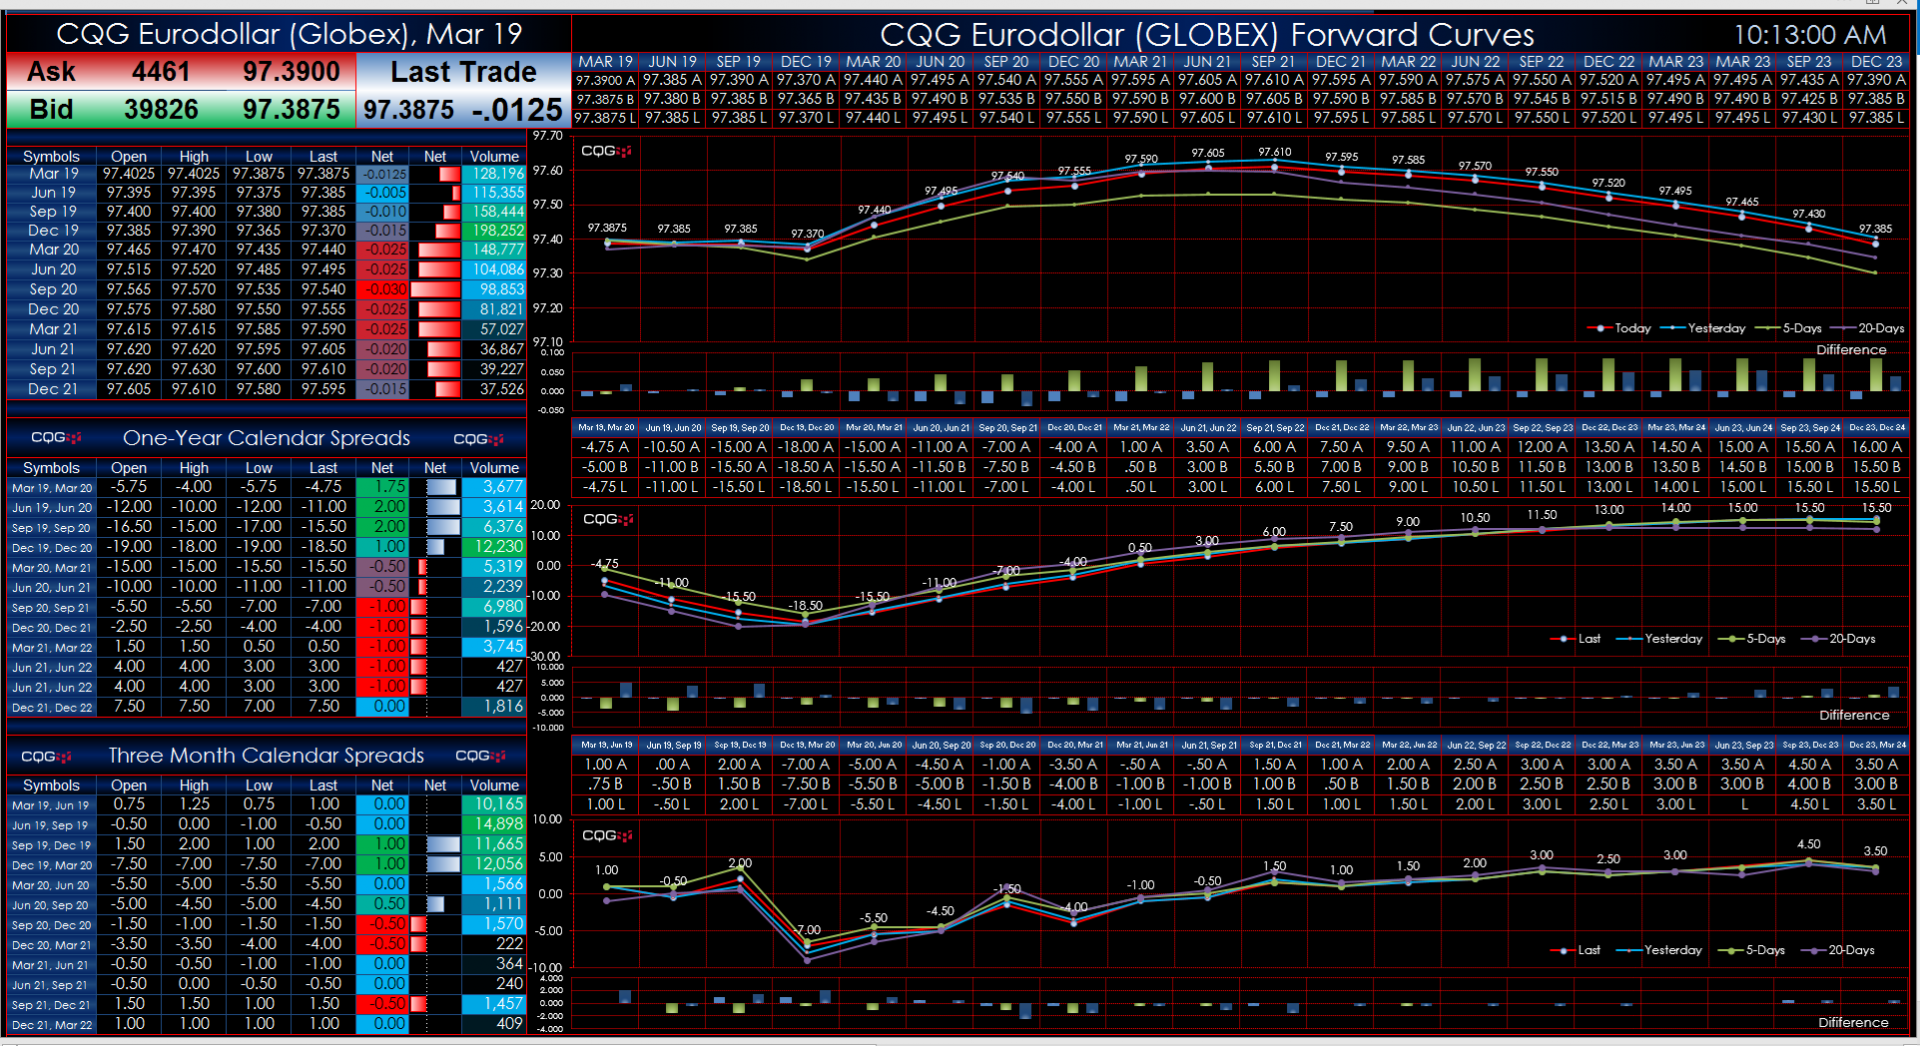
There are three forward curve charts. The first one displays the quarterly contracts forward curves, the second display is the one-year calendar spreads forward curves, and the third chart displays the three-month calendar spreads forward curves. Each chart displays today’s forward curve, yesterday’s forward curve, the forward curve 5-days ago, and the forward curve twenty days ago. In addition, there is difference histogram chart showing each forward curves difference from today’s Forward Curve. There is the current best bid price, best Ask price and last trade directly above the each forward curves data point.
The left-hand side of the dashboard displays market data for the front contract and the next eleven contracts.