This Microsoft® Excel dashboard presents a range of market data using CME Forex Symbols. However, you can enter in your own symbols.
Always use upper case for symbols. Enter into the Symbol Box the symbol.

The top row is the previous session’s open, high, low, and close. You can see the session time for the high and the low. Next to the HiLoAlert is a value that if the difference between the high or low and the last price is that amount or less then the high or low is backlighted red or green.
If the last price matches the open then the open price is highlighted in blue. The PX Alert is a value that if the last price trades at that value the last price is highlighted in red.
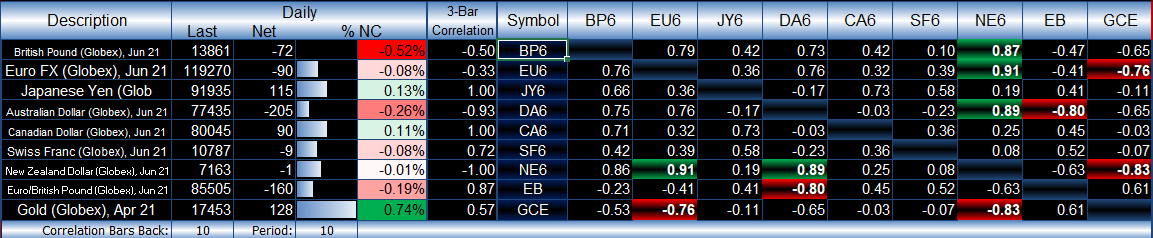
For the correlation matrix enter into the center column the symbols. Enter in the bars for the look back period and the time frame next to Period.
The %NC both uses histogram data bars and heat mapping to highlight the extreme values.
The 3-bar correlation is the last three daily closes compared to time. A +1.00 reading indicates three positive closes in a row. A -1.00 reading indicates three negative closes in a row.
The correlation matrix highlights the top five correlated markets (green) and the bottom five correlated markets (red).
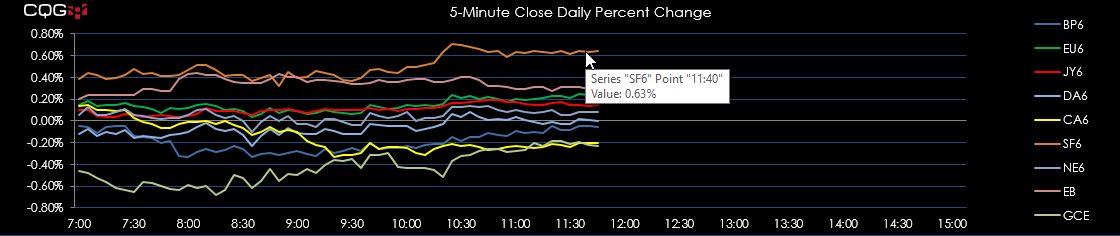
The 5-minute daily percent change chart is using the same symbols used in the correlation matrix. The net percent change is from the previous daily session’s close versus the current 5-minute bar’s close.

The above chart is showing percent net change. You can use any time frame. Here, the time frame is daily. You can change the symbols.

The above is comparing today’s true range to the 5-day average true range. If today’s range is greater than the 5-day ATR, then the value is red. You can change the symbols.

This display is similar to the CQG Thermometer. The daily ranges are normalized. The last price Is displayed as a percentage of where it is located relative to the high and low. If the bar is showing a lot of red to the left, then the last is near the high. If the bar is showing a lot of green to the right, then the last is near the low.
Requires CQG Integrated Client 20 or higher or QTrader 20 or higher. Strongly recommended: Microsoft Office Professional Excel 2016, 2019, 32 or 64-bits installed on your computer, not in the Cloud.