Technical analysts and technical based traders apply various studies to price data, such as a moving average, to smooth the price action. The goal is to filter the moment-to-moment price action, which can be thought of as noise, and the filtered or smoothed line reflects the trend. A rising moving average is considered a bullish trend and a falling moving average indicates a bearish trend.
The smoothed line study is the basis for another set of studies referred to as “Trading Bands”. The trading bands are often a percentage above and a percentage below the smoothed price line with the goal of indicating high- or low-price points relative to the smoothed line. In theory, if the moving average is rising and the price drops to the lower trading band, the price is cheap relative to the averaged price trend. In a similar fashion, if the moving average is declining then if the price rises to the upper band, the price is expensive relative to the averaged price trend.
To start, the first trading band study to review is the Envelop study in CQG IC and QTrader.
Envelope Study
The Envelop study displays two trading bands: The Top Envelope (MATE) and the Bottom Envelope (MABE). While the study has a parameter for the lookback period for the moving average, the study does not display the moving average.
The two lines’ formulas are as follows:
Top Envelope: MATE = MA * ((100 + Percent) / 100)
Bottom Envelope: MABE = MA * ((100 - Percent) / 100)
The percent value is entered in the “Multi” parameter for each line in the Envelope parameters dialog.
There is a second parameter: “Add”, which the value entered is added to the output of the “Multi” parameter for the MATE and subtracted from the “Multi” parameter for the MABE lines.
The Envelope Study Help file provides all the details.
In addition, the types of moving averages available are listed below:
- Simple
- Smoothed
- Exponential
- Weighted
- Centered
- Median
- Trix
- Exponential Hull
For more details regarding the various moving average types available the CQG Moving Average Help file explains the calculations for each moving average.
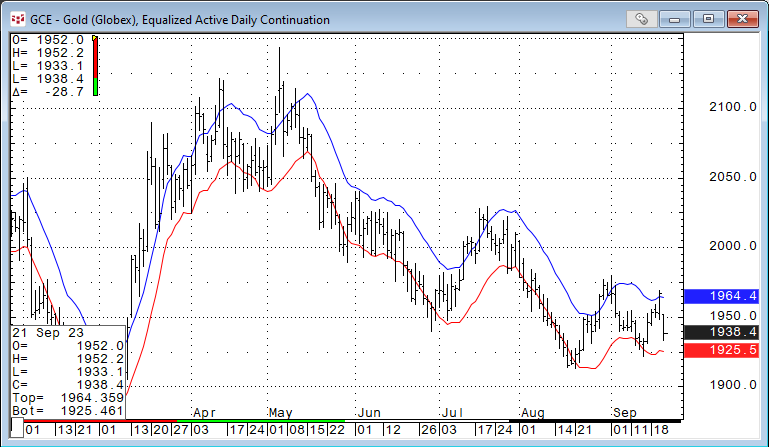
The Moving Average Study has a “Percent” parameter that enables trading bands to display along with the moving average study.
The next two studies incorporate volatility to determine the top and bottom bands.
Keltner Channel Study
The Keltner Channel Study uses a moving average for the center line and includes a measure of the current market’s volatility. The study incorporates the Average True Range (ATR) as a multiplier. The ATR uses the same lookback as the moving average.
The channel lines are drawn by adding to and subtracting from the current moving average value the product of a constant (percent/100) multiplied by the average true range.
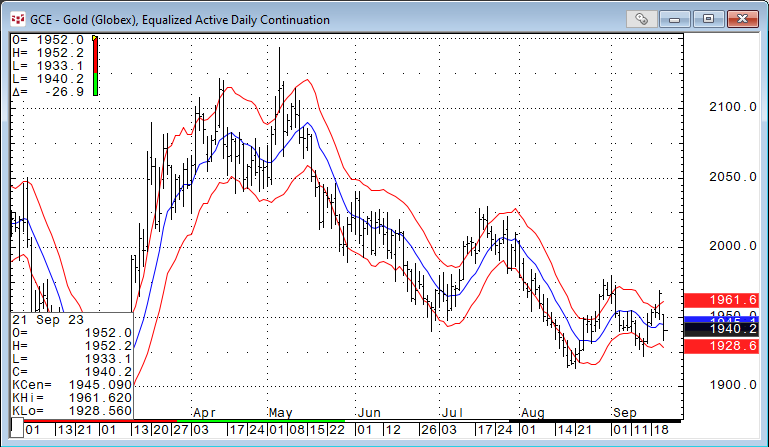
More details are available in the Keltner Chanel Help file.
Bollinger Bands Study
Bollinger Bands use standard deviation as the measurement of volatility. The study has a center line, typically a 20-period simple moving average (SMA) and two price envelopes: The top envelope is 2 standard deviations added to the SMA and the bottom envelope is subtracted from the SMA.
When the market’s price action narrows, then the standard deviation declines, and the bands narrow towards the SMA. If the price action trends, then the standard deviation increases, and the bands widen away from the SMA.
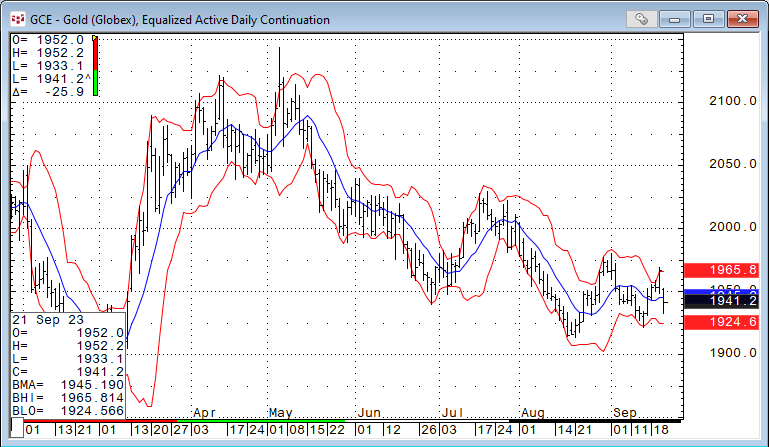
For more discussion, please read CQG Primer: Bollinger Bands® in addition to the Bollinger Band Help file.
The next two studies are smoothing studies that have a “Percent” parameter enabling plotting trading bands.
Kalman Filter Study
The Kalman Filter is a recursive algorithm invented in the 1960s to track a moving target. It is an algorithm that uses a series of measurements observed over time, containing statistical noise and other inaccuracies.
The Kalman Filter is typically used to forecast future price movement. The Kalman Filter works in two stages:
- Predict current state based on last state, taking noise into account
- Update: takes measured values, and updates the current estimate
The Kalman Filter has the parameter NoiseCovRatio. This is a ratio of measurement noise to process noise variance. Large values of NoiseCovRatio make the trend smoother, but slow down reaction to the change in trend. Small values of NoiseCovRatio make noise smoothing worse but keeps good reaction to the change in trend.
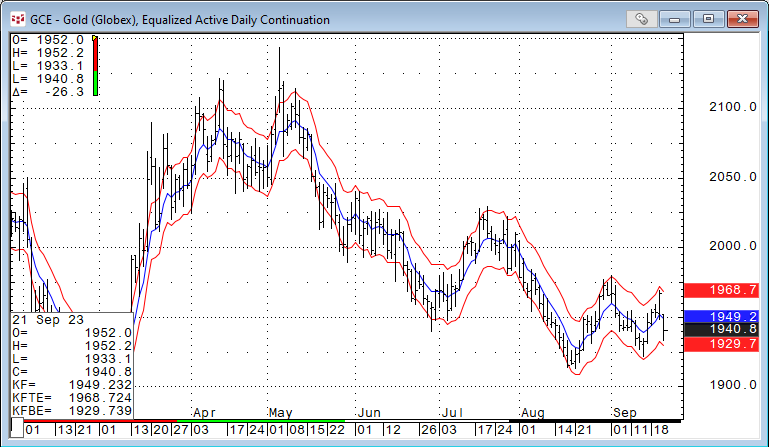
The Kalman Filter study has a “Percent” parameter. This parameter enables display trading bands. More information is available from the Kalman Filter Help file.
Moving Linear Regression Study
Moving Linear Regression, also known as the End Point Moving Average, begins by fitting a straight line to a set of price points. These points are specified by the Price and Period parameters. The process of fitting the line to the data points uses the least squares technique. This technique finds the line that minimizes the sum of the squares of the distances between each point and the line.
The value of the fitted line at the last point (the end point of the line) for the specified period is plotted on the chart.
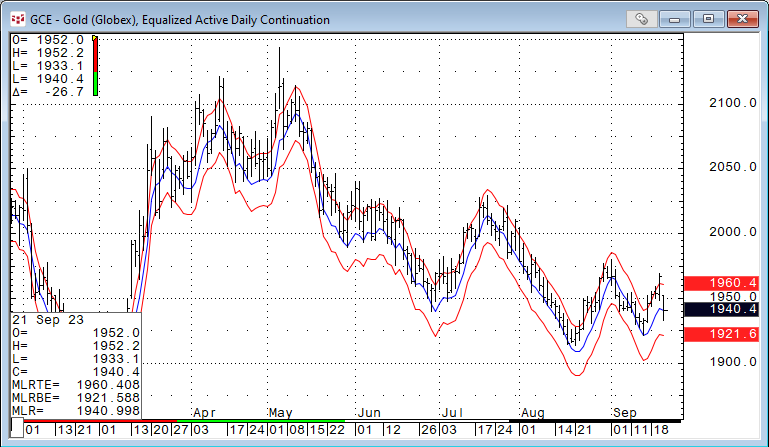
The Moving Linear Regression study has a “Percent” parameter. This parameter enables display trading bands. More information is available from the Moving Linear Regression Help file.
Stationary
The above studies look interesting for being components of trading systems. Some appear valuable for trending markets, and some appear valuable for sideways markets. The issue is what statistical analysis refers to as Stationary. Wikipedia defines Stationary as “In mathematics and statistics, a stationary process is a stochastic process whose unconditional joint probability distribution does not change when shifted in time.
Consequently, parameters such as mean and variance also do not change over time.
However, market price action leads to the mean and variance changing over time. There are trends, seasonal influences, and noise. This lack of stationary is something to keep in mind.