Oscillator studies are a part of most traders’ and analysts’ approaches to analyzing the markets. Oscillators calculate differences between prices, which detrends the price data. In this post, the topic of oscillators will be detailed including the basics of the oscillators available in CQG One and an exploration of how much one oscillator correlates with a different oscillator. This is important as two oscillators with similar calculations and with a high correlation are not confirming each other.
The next image displays a simple oscillator named Momentum (Mon) and is using a 10-bar lookback period. The Momentum study plots the difference between the current price and a prior price (the user decides the lookback period). Momentum is centered on zero. Therefore, it is positive when the price is above its prior value and negative when it is below. The unit used for measurement is the minimum scale increment of the market being studied.

Momentum may simply be used to measure the net change of a market between two bars. It is the close - close 10 bars ago. If the closing price is higher than the close 10 bars ago then the oscillator is positive and if the close is below the close 10 bars ago then the oscillator is negative. This particular oscillator is not bounded. Therefore, the oscillator values can be any value. Some oscillators are bounded; that is the values cannot be less than zero or greater than 100.
Next, the Average True Range (ATR) study calculates the moving average of the True Range over the specified period.
True Range = True High - True Low.
True High = The greater of the current bar's high or the close of the previous bar.
True Low = The lesser of the current bar's low or the close of the previous bar.

The user can choose the moving average lookback. The image above shows the ATR using a 10-bar lookback period for the moving average.
Intraday Momentum Index (IMI)
The Intraday Momentum Index (IMI) is a technical indicator developed by market technician Tushar Chande.
The indicator combines aspects of candlestick analysis with the relative strength index (RSI) calculation in order to generate overbought or oversold signals.
Where:
Gains = CP − OP on Up Days, i.e., Close > Open
CP = Closing price
OP = Opening price
Losses = OP − CP on Down Days, i.e., Open > Close
d = Days
n = Number of days (14 is commonly used)
The image above shows the IMI set to a 10-bar lookback.
Klinger (KVO)
The Klinger Volume Oscillator was developed by Stephen Klinger. The study uses the difference between two exponential smoothed moving averages of the “Volume Force” and includes a signal line.
Formula
Key Pricet = (Hight + Lowt + Closet)/3
Key Pricet-1 = (Hight-1 + Lowt-1 + Closet-1)/3
Volume Force = VF = (if Key Pricet > Key Pricet-1 , Volume otherwise -Volume)
KVO = EMAshort−period (VF)− EMAlong−period (VF)
KVO Signal = EMAsignal (KVO)
Klinger Oscillator Signal line = KOS = 13 Period EMA of KVO

The key difference between the KVO and many other oscillators is the use of traded volume in the calculation.
Moving Average Convergence Divergence (MACD)
The MACD measures the difference between two exponential moving averages of different lengths, in addition, a trailing moving average of the MACD is plotted (MACDA), this is commonly referred to as the “Trigger” line. The two moving averages have different sensitivities to market action, thereby providing an indication of a change in the market environment. Gerald Appel defined the MACD with its default parameter values.
Calculation:
MACD = Exponential MA1 - Exponential MA2
MACDA = Exponential MA of MACD
The length of the two EMAs smooths the price data.
Relative Strength Index (RSI)
Relative Strength Index is a price momentum indicator. Mathematically, RSI is represented as:
RSI = 100 - [100/(1+RS)]
where,
RS is the ratio of the smoothed moving average of n-period gains divided by the absolute value (that is, ignoring sign) of the smoothed moving average of n-period losses.
RSI depends solely on the changes in closing prices. Despite its name, it has nothing in common with the traditional relative strength concept, whereby the price of a stock is divided by a broad market index (such as Standard & Poor's 500 Index) to arrive at a ratio that shows the trend of a stock’s performance relative to the general market. Instead, the RSI is actually a front-weighted price velocity ratio for only one market.
Also, RSI momentum divergences, that is the market is making new highs or new lows and the RSI study is not making new highs or new lows, are often highlighted as trading signals. However, it is not uncommon during a strong upward trend or weak downward trend to see multiple divergences between RSI and the price action.

The RSI study in the image above was set to a 10-bar lookback period.
Slow Stoch
When Slow Stochastic is selected, the system internally calculates the Fast Stochastic, however, only the Slow %K and Slow %D lines are displayed on the screen.
Slow %K - Is equal to the Fast %D.
Slow %D - Is a Moving Average of Slow %K values. The default for Slow %D is a Smoothed 3 Period Moving Average.
K: = (MA(Close (@)- LoLevel(@,10),Smo,3)/ MA(HiLevel(@,10)- LoLevel(@,10),Smo,3))*100
D: = MA((MA(Close (@)- LoLevel(@,10),Smo,3)/MA(HiLevel(@,10)-LoLevel(@,10),Smo,3)),Smo,3)*100

Fast Stoch
Fast %K (FSTOCH) - The system identifies the highest high, lowest low, and the current Price for a specified Period.
It subtracts the lowest low from the current price, and then divides the difference by the range, (where the range is the highest high - lowest low). The result becomes the first Fast %K value.
The system continues to calculate Fast %K values by excluding the oldest bar and including the next more recent bar before repeating the above calculation.
Fast %D (F STO %D) - Is a Moving Average of Fast %K values. The default for Fast %D is a Smoothed 3 Period Moving Average.

The Fast Stochastic study is more sensitive to the price action than the Slow Stochastic study.
Williams %R
The %R calculation identifies the highest high, lowest low, and the current price for a specified period.
It subtracts the lowest low from the current price, and then if range is not empty (highest high - lowest low = 0), it divides the difference by the range, (where the range is the highest high - lowest low) otherwise %R value will be 50%. The result becomes the first %R value.
The system continues to calculate %R values by excluding the oldest bar and including the next more recent bar before repeating the above calculation.
This study can be used to set up support and resistance strategies, similar to how the Stochastic Indicator is used. The buy setup occurs when %R gets below 20 and the sell setup occurs when %R is above 80.
If %R falls below 80, it would be a sell signal. If it rises above 20, it is a buy. This study is best for shorter trends.

The %R study is sensitive to short term price fluctuations.
Looking over all of the CQG One charts with each study displayed indicates that there is a certain degree of overlap between the plot lines of each study. In other words, some of the studies appear to be correlated with each other.
To look into this each of the study’s outputs are brought into Excel from CQG IC using daily bars from 2023 for Crude Oil (Symbol: CLE) using adjusted continuation price data. Then a rolling 10-day correlation for each study compared to the Momentum study for the year.
Next, Excel's Frequency function is employed. This function returns the number of times a score lands in a range of values. The frequency function counts the number of times the historical individual correlation value lands in a "bin." The bins range from 1.00 to -1.00 in 0.025 steps.
This approach is gauged towards recognizing that multiple studies used in a trading system may be simply reflecting the same information, not confirming the same information.
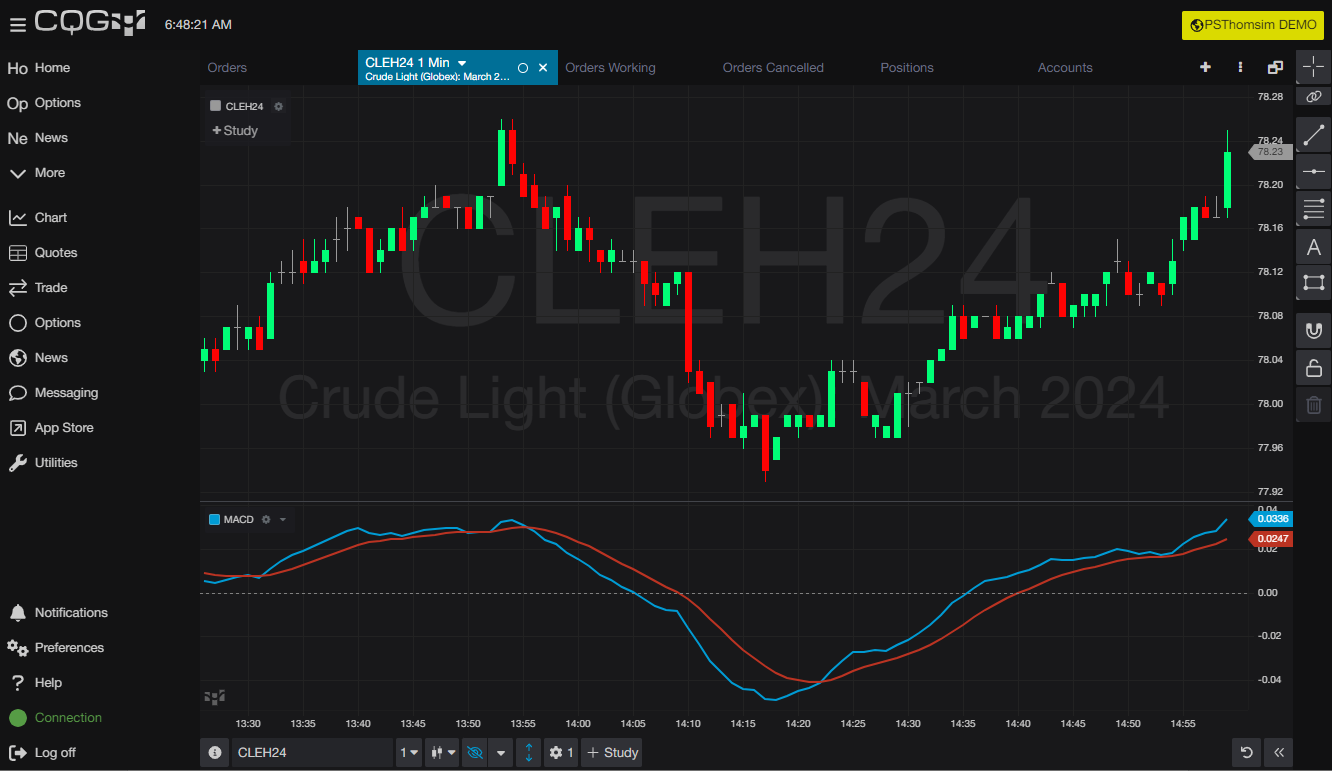
The first analysis compared the Momentum study to the Average True Range study.
Viewing the image above the correlation between Momentum and ATR is very wide ranging. The reason is the ATR study is calculating difference between each bar’s high and low and that value is smoothed with a moving average. The Momentum study is calculating the difference between the current price and the closing price 10 bars ago. These two studies are very different calculations.
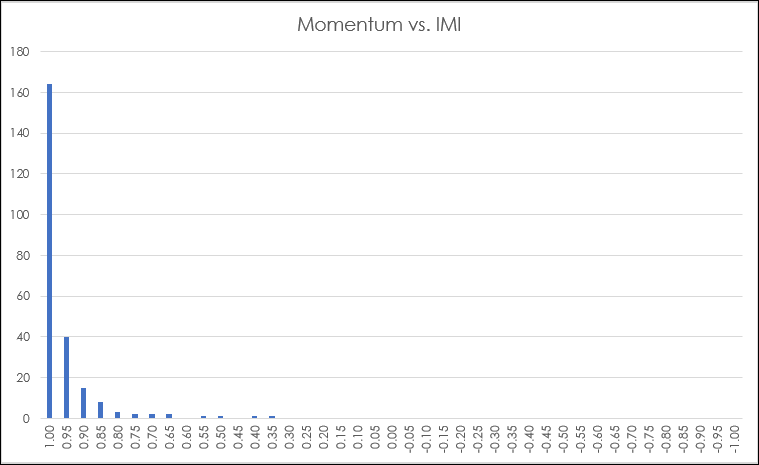
The frequency distribution chart comparing Momentum and the IMI study indicated these two studies are often very highly correlated.
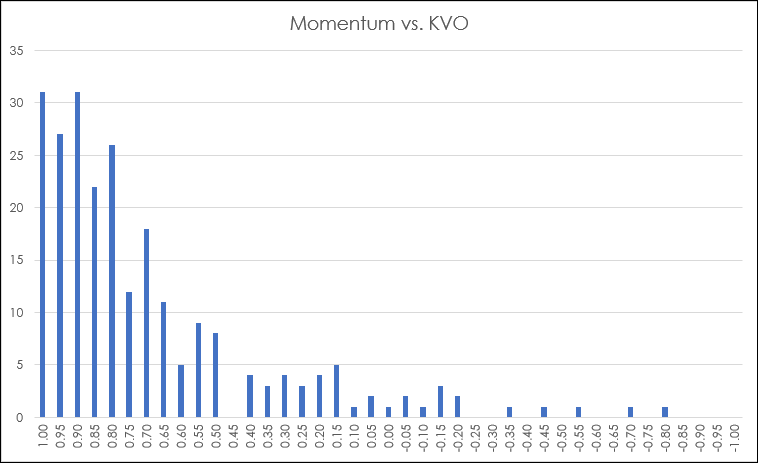
The frequency distribution chart comparing Momentum and the KVO study indicated these two studies are at times highly correlated. However, the use of volume in the KVO study leads to low correlation values at times compared to the Momentum study.
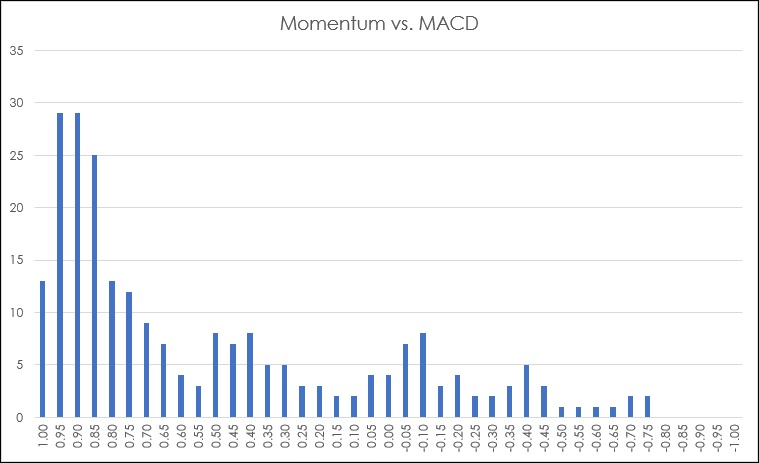
There are times the MACD and the Momentum study are highly correlated, and due to the difference in the calculations of the two studies the correlation can be negative.
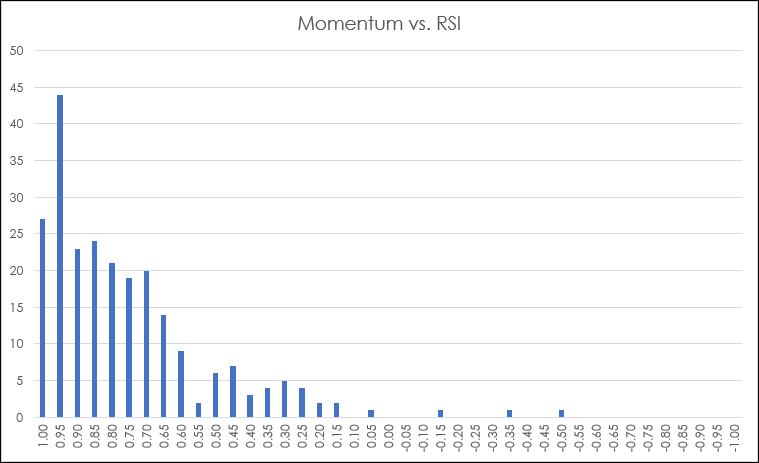
The RSI study was also highly correlated to the Momentum study at certain times.
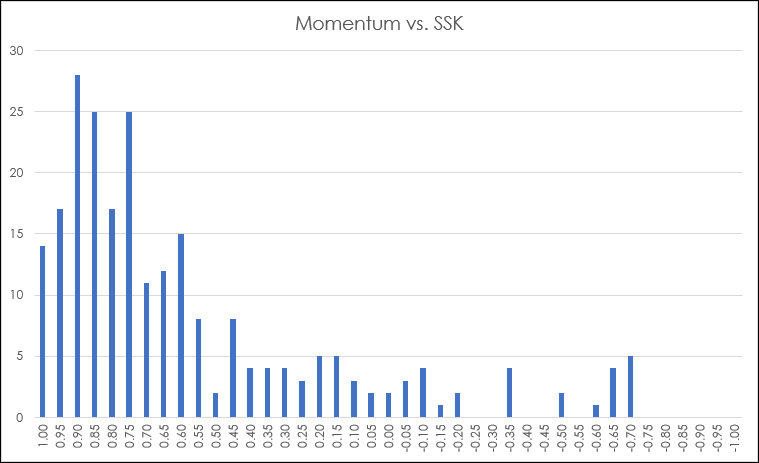
The %K line values from the Slow Stochastic study were used for the correlation analysis compared to the Momentum study values. The Frequency Distribution analysis indicates the two studies are correlated much of the time.
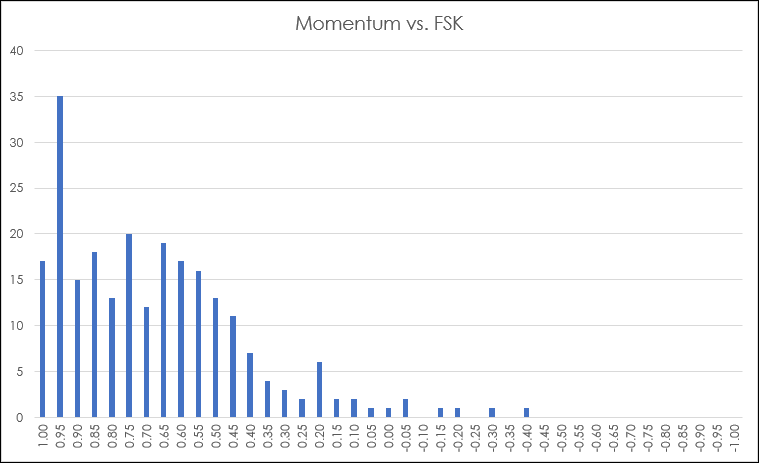
The FAST %K line values from the Fast Stochastic study were used for the correlation analysis compared to the Momentum study values. The correlations shifted to the right when comparing to the Frequency Distribution chart of the Slow Stochastics study.

The Frequency Distribution chart of the Momentum versus %R study is identical to the Frequency Distribution chart of the Momentum versus Fast %K. This is because the calculations of the two studies are identical.
Conclusion
When designing a technical approach to perform analysis or the basis for trading system it is important to fully understand the technical studies being employed. Most importantly, recognizing that multiple confirmations by studies that have similar calculations and are highly correlated does not necessarily lead to better results.