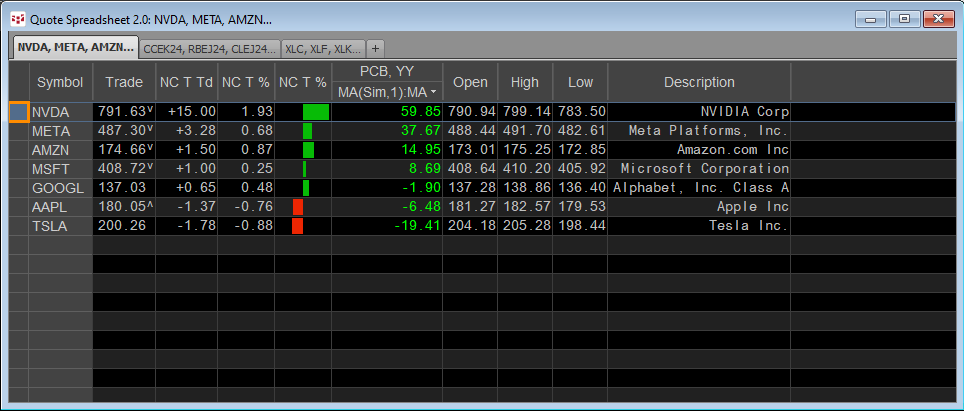
A popular form of market analysis is to maintain a real-time table of market performance based on an annualized basis. For example, the QSS 2.0 displayed below has a sorted column highlighted with the yellow font detailing the percent net change so far for the year by the stocks known as the magnificent seven. We can see NVIDIA is the current top performer, up 59.85% for the year and Tesla is the worst performer at -19.41%
This post walks the reader through the steps to building a QSS 2.0 with this feature as well as how to visually display the annualized performance of the individual stocks using the Percent Bar chart with the Analog study.
At the end of the post a downloadable PAC which installs a page displaying the QSS 2.0 and the Percent Bar chart detailed here. In addition, an Excel sample using RTD functions for real-time updates.
To start, first open a QSS V 2.0 Spreadsheet and add the symbols of your choice. Then configure the columns for today's market data based on the instructions in this Help file.
To add the percent change column with the QSS 2.0 in focus hit the key combination Ctrl+Shift+H. This dialog opens.
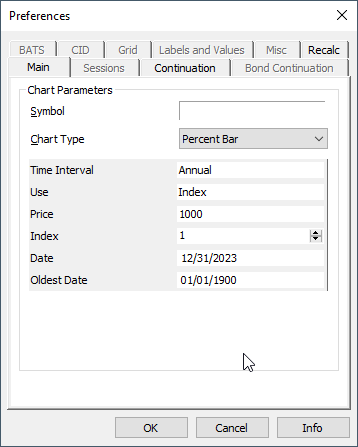
Set the Preference to Chart Type = Percent Bar, Time Interval = Annual. Use = Index, Index = 1. This preference returns the current annual Percent Bar chart value for this year.
A warning will open stating that there is no associated chart study, and would you like to add the simple moving average study? Click Add study.
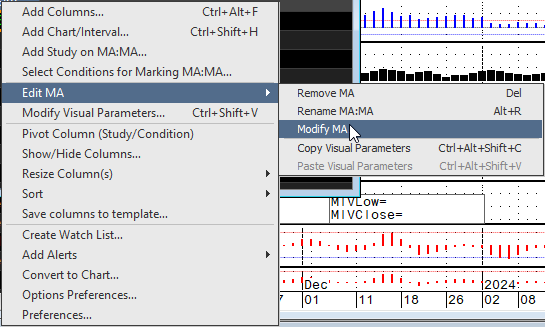
However, the moving average needs to be set to 1 period, which is the current close. Right-click the column title and select edit MA and then Modify MA and set the period to 1.
You have now added the percent net change column for this QSS 2.0. Next, right-click the column title and the same dialog above opens and click Sort and then click descending.
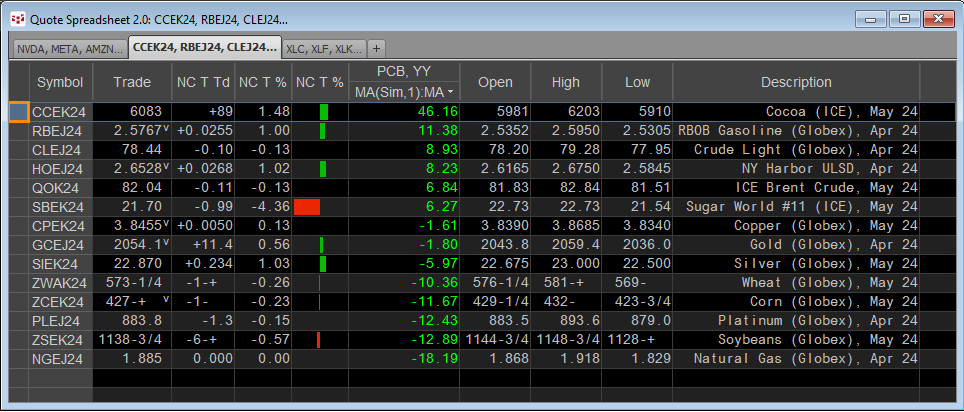
The above displayed QSS 2.0 is a list of commodities sorted by percent change for the year.
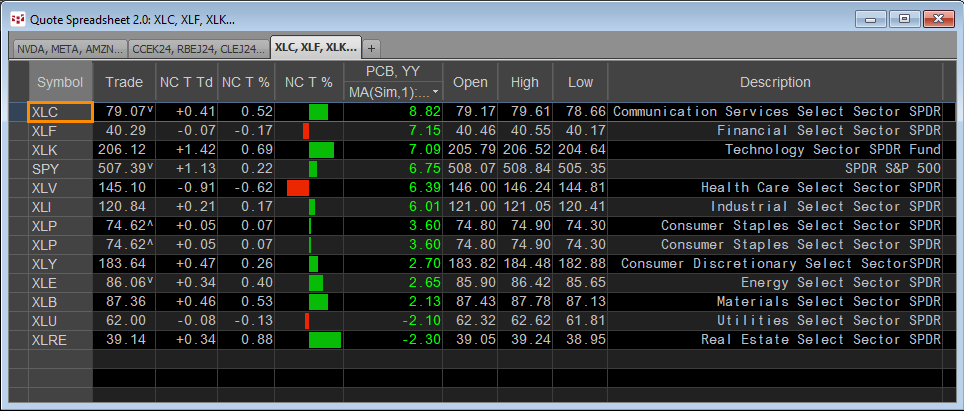
The above displayed QSS 2.0 is a list of the eleven stock market sectors sorted by the percent net change for the year.
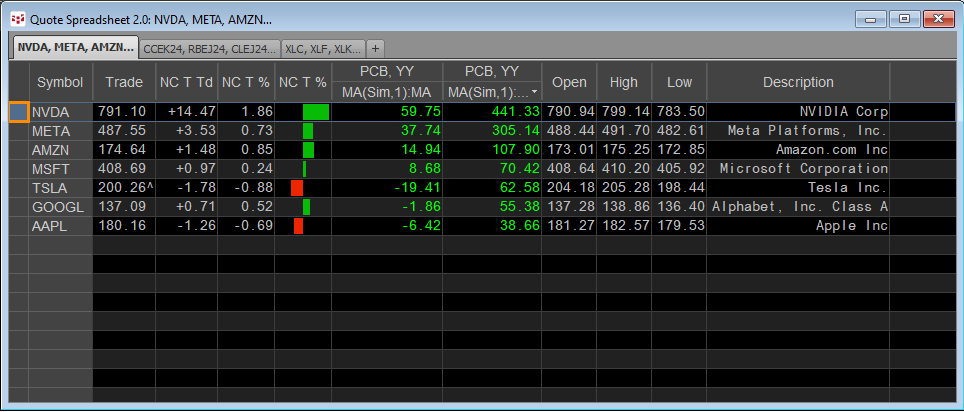
The above displayed QSS 2.0 is the same "magnificent seven" with the addition of a second percent net change with the Index set to 2 (years) and sorted. Tesla (symbol: TSLA) has moved up in the rankings to 62.58% return combining last year's and this year's performance.
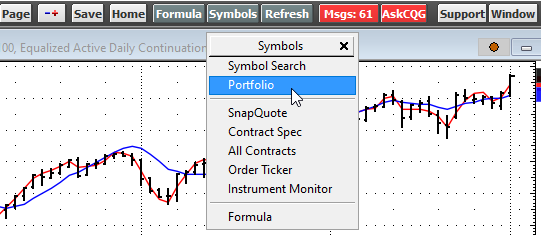
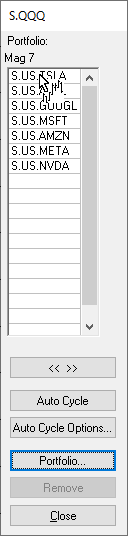
To do a similar analysis using a Percent Change chart first create a Portfolio by selecting Portfolio from the Symbols toolbar button.
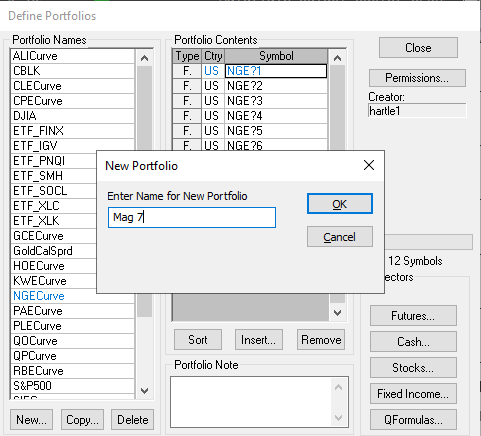
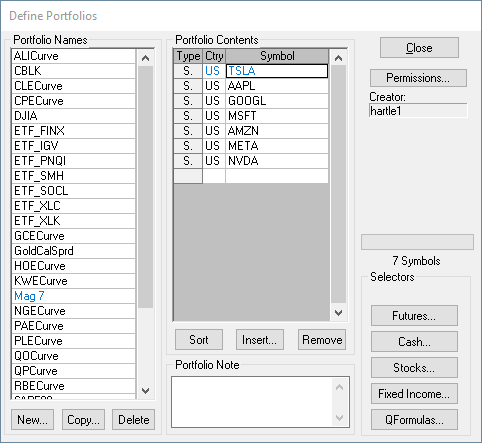
Click New and name the portfolio, such as "Mag 7".
An empty Portfolio Contents window appears. You can copy and paste from another source to load the symbols, such as this list (use Ctrl+C to select the symbols and Ctrl+V to paste the symbols into the Portfolio Contents window):
S.NVDA
S.META
S.AMZN
S.MSFT
S.GOOGL
S.AAPL
S.TSLA
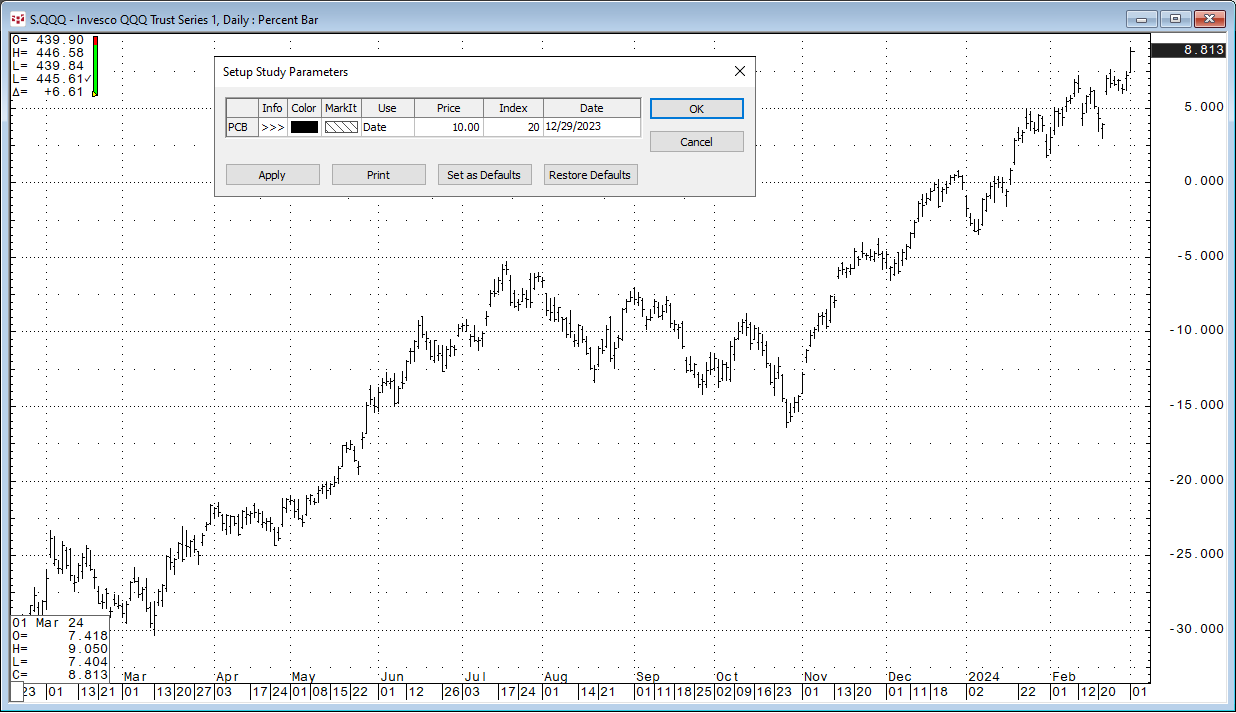
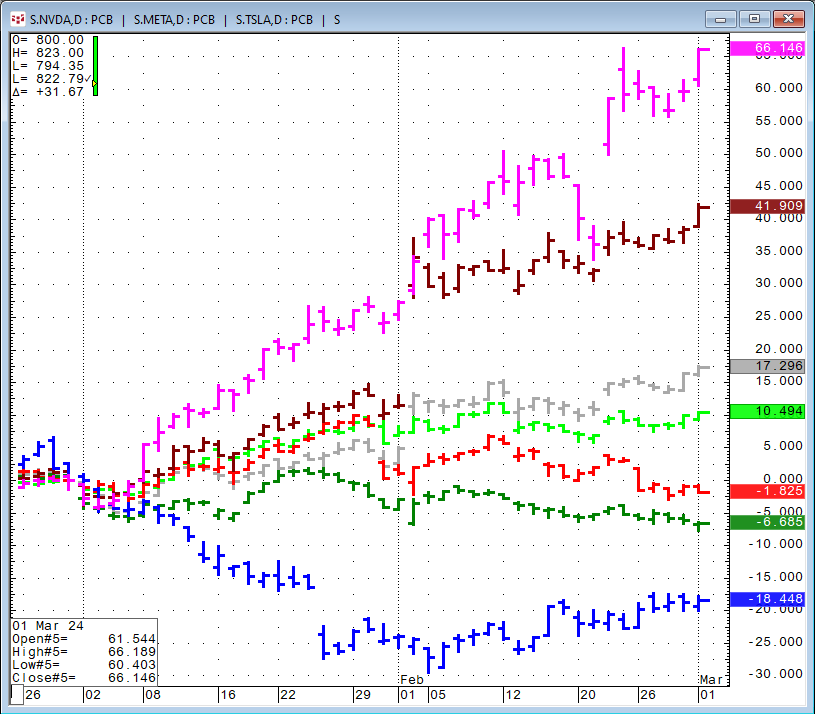
Next, open a Percent Change chart and set the parameters to use "Date" and set the date to 12/29/2023.
Next, right-click in the chart's Entry Field and select Portfolio.
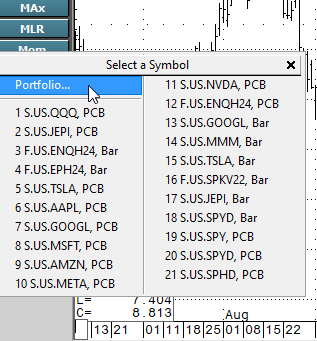
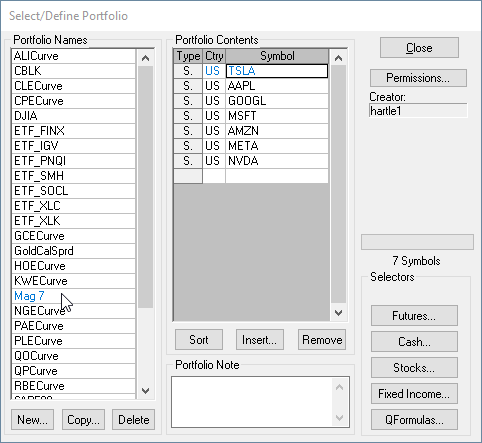
Select the portfolio, here Mag 7. Then, close the portfolio.
A new window opens.
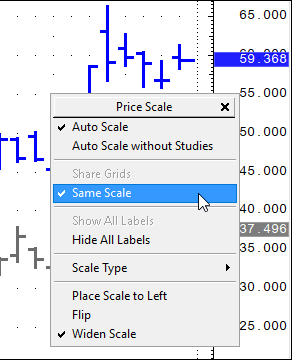
Notice above that the mouse now includes a chart icon. Select the first stock in the portfolio and the Percent Bar chart changes to that stock. Next, click the Analog study on the Toolbar and select the second stock. Then, right-click on the price axis and check that "Same Scale" is selected. Then, click the Analog study and then select the next stock. Repeat this step until all stocks have been added. Then close the Portfolio window.
Once all of the stocks are added to the chart hit key combination Ctrl+Alt+M to open the Modify studies window. Below, each price bar for the individual stocks are colored using various shades of grey to black.
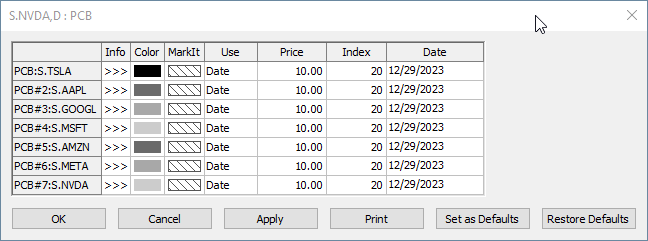
You can change the colors of the bars by selecting the Color and choosing a different color from the palate.
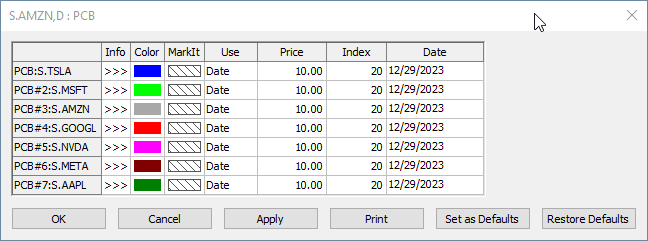
The results are shown below. If you want the chart to always use the current year then change Use from Date to Index and enter 1 in the Index column.
A downloadable CQG PAC is included at the bottom of the post. The page displayed below is installed.

In addition, a downloadable Excel spreadsheet (requires Excel 365 or Excel 2021) is available at the bottom of the post to replicate the same market data information.

Columns A has the symbol and column B is the annual percent change RTD formula:
=RTD("cqg.rtd",,"StudyData",A2,"PCB","BaseType=Index,Index=1","Close","Y",,"all",,,,"T")/100Columns C and D use the Sortby function entered in cell C2.
=SORT(A2:B8,2,-1)
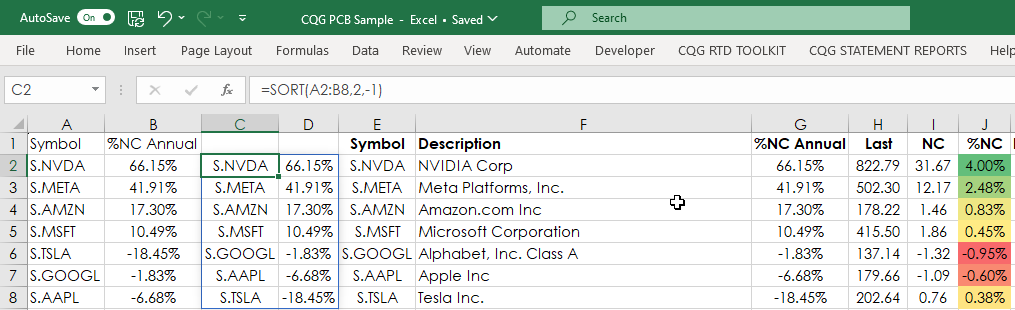
Then, column E uses the sorted data for the symbols from Column C. Columns A through D are hidden.
One other feature is Column S, which is the percentage ratio of today's traded volume compared to the previous session's volume and is heat mapped.
Requirements: CQG Integrated Client or QTrader, and Excel 365 or Excel 2021 (locally installed, not in the Cloud) or more recent.