
So far this week the Fixed Income futures markets are mostly lower. The TSE 10 Year JGB, Sep 24 contract is down -0.35%. The best performer in the US market is the 2yr US Treasury Note (… more

This midweek snapshot shows a mostly negative performance for the Equity Index futures markets. However, the best performer in the Japanese market is the JPX Prime 150 Index, Sep 24… more

Each Wednesday this article will be updated with the current seasonal study using CQG's Seasonal analysis applied to the Soybean, Wheat and Corn markets. You can download the CQG pac providing the… more
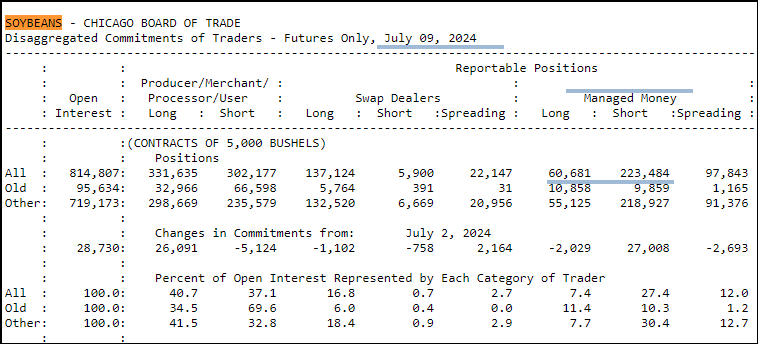
Tracking and analyzing cash market data is more difficult because most cash market data is a single print for the day of the report, that is there is no open, high, low or close, just the close.… more

The Fixed Income futures markets are mostly higher so far this week. The TSE 10 Year JGB, Sep 24 contract is unchanged 0.00%. The best performer in the US market is the 30yr US Treasury… more
This midweek snapshot shows a somewhat positive performance for the Equity Index futures markets. The best performer in the Japanese market is the TSE REIT Index, Sep 24 contract with a +0.… more
Each Wednesday this article will be updated with the current seasonal study using CQG's Seasonal analysis applied to the Soybean, Wheat and Corn markets. You can download the CQG pac providing the… more
Various improvements and bug fixes.
Trading/ReportingOrder Ticket: Added OCO orders Order widget: Ability to copy full row of data using the download buttonManual fills confirm dialog:… more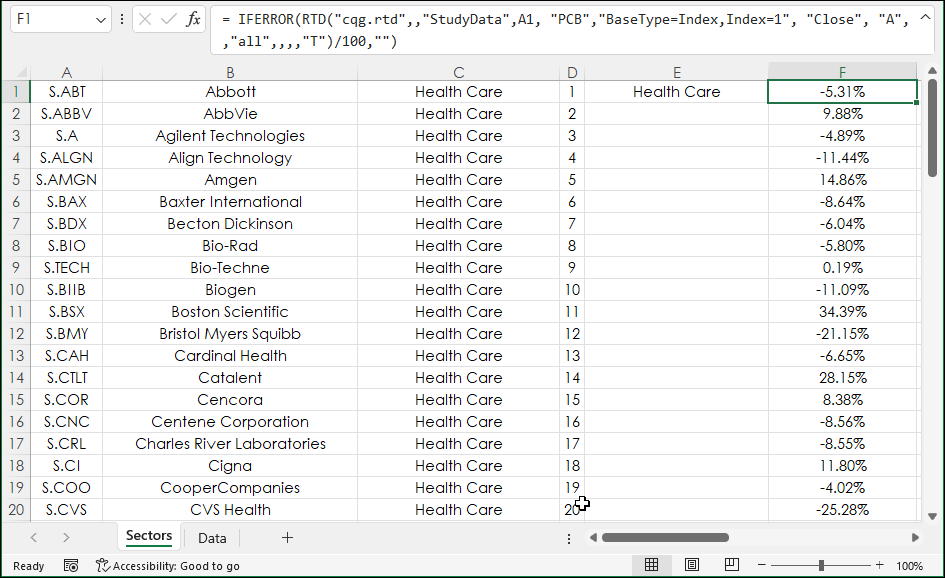
The Excel 365 Filter function is a member of the Dynamic Arrays group. The function is useful for sorting through a large table of data.
The function is:
=FILTER(Array, Include, [If Empty… more
The Fixed Income futures markets are mostly lower so far this week. The TSE 10 Year JGB, Sep 24 contract is down -0.02%. The best performer in the US market is the 2yr US Treasury Note (… more