The Excel 365 Filter function is a member of the Dynamic Arrays group. The function is useful for sorting through a large table of data.
The function is:
=FILTER(Array, Include, [If Empty])
Where:
Array
(Required) The range or array of values to filter
Include
(Required) The criteria supplied as a Boolean array (TRUE and FALSE values). The height of the Include parameter height (when the data are in columns) or width (when the data are in rows) must be equal to the that of the array parameter.
If Empty
(Optional) The value or text to return when no entries meet the criteria
This post uses an example of filtering the constituents of the S&P 500 index by sectors and then reviewing the current annual percent net change of each of the stocks in the selected sector and the top and bottom 5 performers.
The downloadable Excel sample file has a data tab which lists each stock’s Symbol, Description and GICS Sector. In addition, there are columns for the GICS Sub-Industry, the Headquarters Location, the Date added to the S&P 500 index, Central Index Key, and the year the company was Founded.
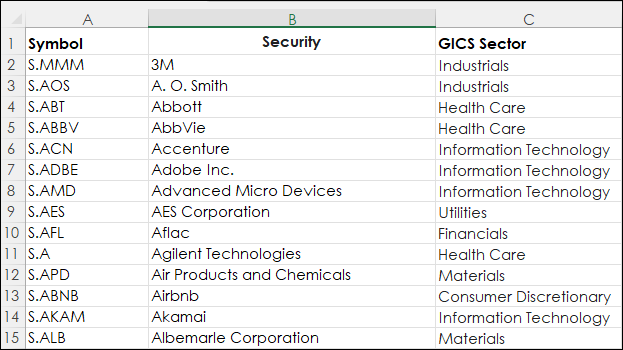
The data is from Wikipedia.
The Sectors tab uses the Filter function to pull in a list of stocks from the Data tab by sector. Cell E1 has a drop-down menu with a list of the selectors to choose from.
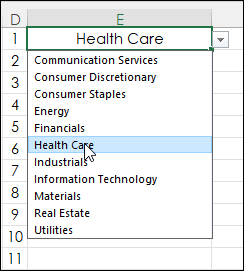
The drop-down list in cell E1 was created using Data Validation.
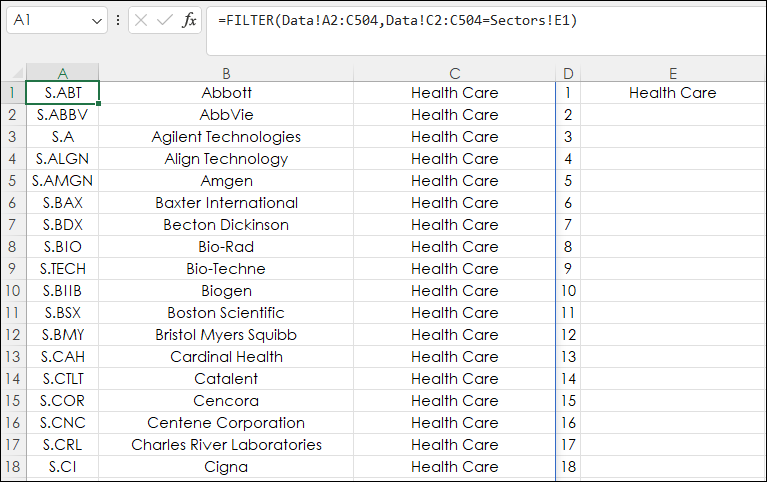
The Filter function in cell A1:
=FILTER(Data!A2:C504,Data!C2:C504=Sectors!E1)
The array to review is Data!A2:C504, the column to include is Data!C2:C504 and return the symbols that have the sector listed in cell E1. This returns a Dynamic Array that “spills” across columns A, B, and C and down the number of rows to complete the list of stocks.
Column F uses RTD formulas to pull in the current annual percent net change for each stock.
=IFERROR(RTD("cqg.rtd",,"StudyData",A1, "PCB","BaseType=Index,Index=1", "Close", "A",,"all",,,,"T")/100,"")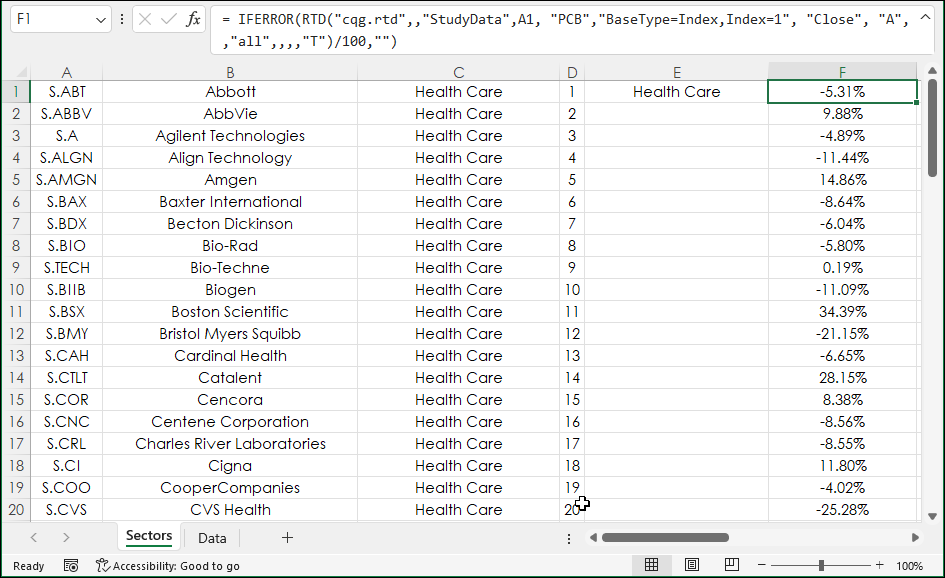
Columns K through P display the top 5 and the bottom 5 stocks by annual percent net change. The LARGE function is used in column K to pull in the values based on 1,2,3,4, and 5 in column H.
=LARGE($F$1:$F$80,H1)
Then with the annual percent net change values pulled in the XLOOKUP function is used to pull in the matching symbol in column A.
=XLOOKUP(K1,$F$1:$F$80,$A$1:$A$80)
And the matching description from column B.
=XLOOKUP(K1,$F$1:$F$80,B$1:$B$80)
Column D has a counter to determine the number of rows with data.
Cell D1: 1
Cell D2:
=IF(A2="","",D1+1)
The above formula is copied down.
The LARGE function uses the MAX function applied to column D to pull in the worst annual percent net change in cell P1.
=LARGE($F$1:$F$80,MAX($D$1:$D$80))
Cell N1 pulls in the symbol for worst annual percent net change.
=XLOOKUP(P1,$F$1:$F$80,$A$1:$A$80)
Cell O1 pulls in the description for worst annual percent net change.
=XLOOKUP(P1,$F$1:$F$80,$B$1:$B$80)
For the next four bottom performers the MAX function has -1, -2, -3, and -4 included.
=LARGE($F$1:$F$80,MAX($D$1:$D$80)-1)
And the same XLOOKUP functions are used for the symbol and the description.
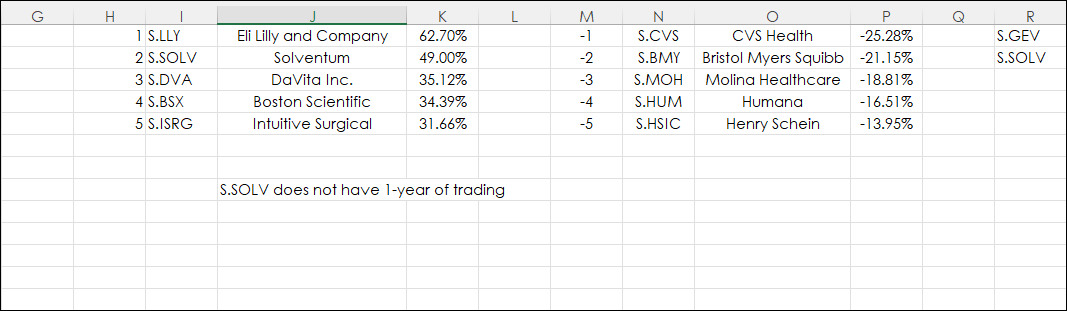
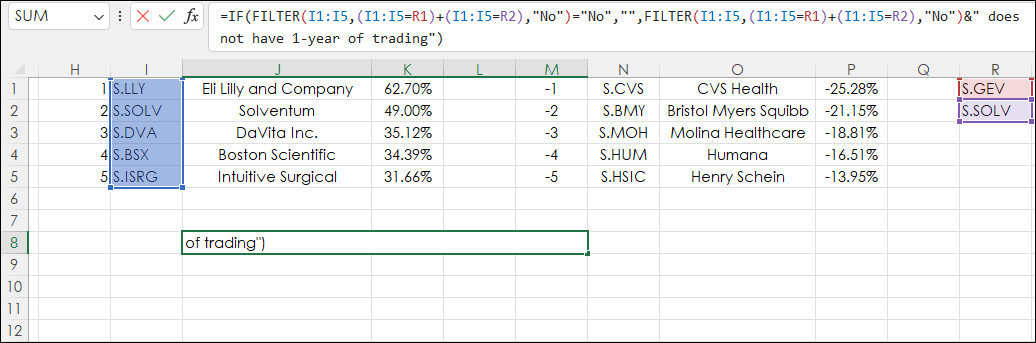
Lastly, two of the stocks in the S&P 500 do not have a full year of trading. The FILTER function can have multiple criteria by adding the arguments to the Include parameters in the FILTER function.
In this case, if one of the two symbols is returned the symbol and the text is merged and displayed in cell J8.
=IF(FILTER(I1:I5,(I1:I5=R1)+(I1:I5=R2),"No")="No","",FILTER(I1:I5,(I1:I5=R1)+(I1:I5=R2),"No")&" does not have 1-year of trading")
The Excel 365 FILTER function is very useful for sorting through a large data set for certain criteria.
Requirements: CQG Integrated Client or QTrader, and Excel 365 (locally installed, not in the Cloud) or more recent.