Tracking and analyzing cash market data is more difficult because most cash market data is a single print for the day of the report, that is there is no open, high, low or close, just the close. In addition, there is no volume of trading.
That being said one way to analyze data is to review the current published data point relative to a lookback range of values. For example, calculate a ratio where the numerator is the current value minus the lowest value in the lookback range and the denominator is the highest value minus the lowest value in the lookback range. The result is a percentage value relative to the range of values. This result may be helpful, or it may not be.
This concept is the point of this article. The data used as an example is CFTC COT data, specifically money manager data, which is the number of contracts held by money managers either long or short.
First, an introduction to the CFTC COT data.
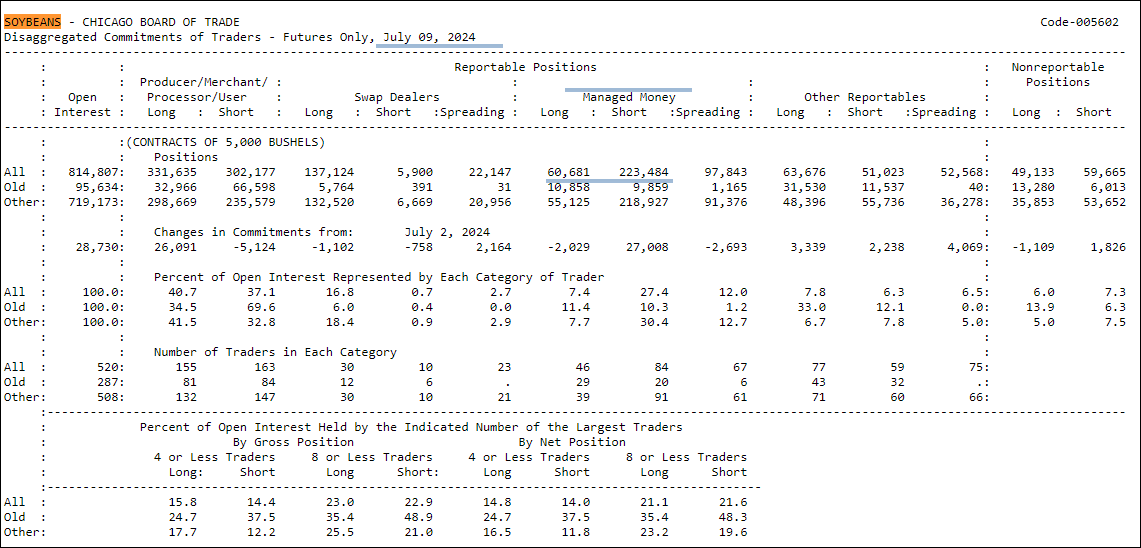
"The Commodity Futures Trading Commission (Commission or CFTC) publishes the Commitments of Traders (COT) reports to help the public understand market dynamics. Specifically, the COT reports provide a breakdown of each Tuesday's open interest for futures and options on futures markets in which 20 or more traders hold positions equal to or above the reporting levels established by the CFTC.The Disaggregated COT report increases transparency from the legacy COT reports by separating traders into the following four categories of traders: Producer/Merchant/Processor/User; Swap Dealers; Managed Money; and Other Reportables. The legacy COT report separates reportable traders only into "commercial" and "non-commercial" categories."
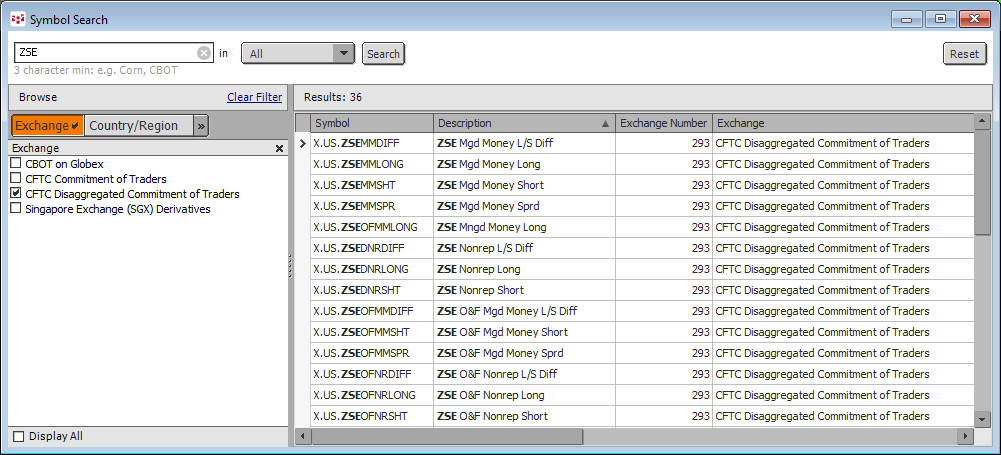
The COT reports are published as a text file on the CFTC site.
The COT data is published late Friday with a trade date of the previous Tuesday.
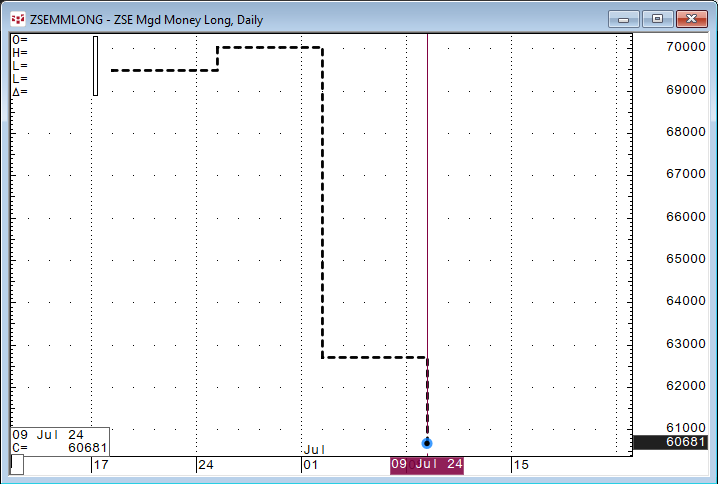
The data is available from CQG.
The market for the purpose of this article is the soybean market. The COT data are contract holdings by Money Managers.
Here is the CFTC's description of a "Money Manager": A "money manager," for the purpose of this report, is a registered commodity trading advisor (CTA); a registered commodity pool operator (CPO); or an unregistered fund identified by CFTC.6 These traders are engaged in managing and conducting organized futures trading on behalf of clients."
The reason for looking at Money Managers is their commitments may indicate a market direction bias or expectation by the Money Managers. The other participants in the CFTC COT reports are likely to be using their holdings in futures contracts to hedge their risk, which is a business decision.
A caveat: This topic is not for the purpose of designing a trading system but more for adding one more tool for market analysis.
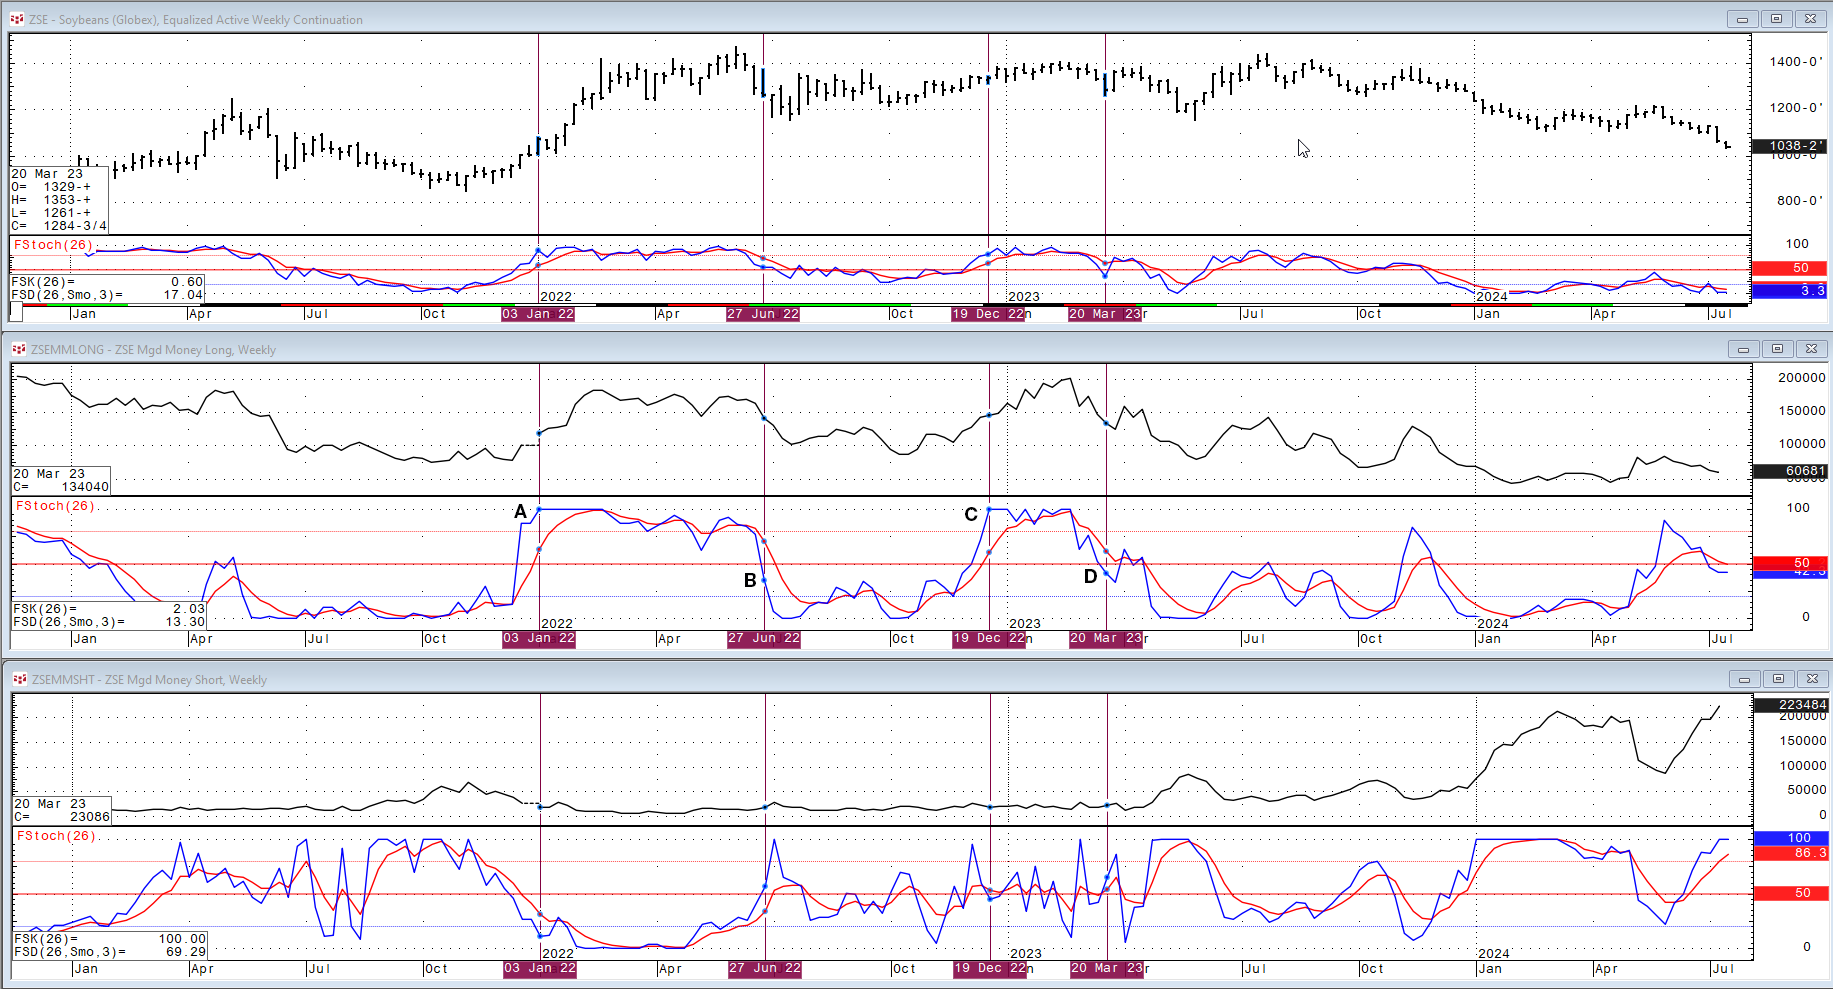
This next chart displays weekly market activity for Soybeans (Symbol: ZSE), the weekly COT data for Money Managers Long (Symbol: X.US.ZSEMMLONG) and the weekly COT data for Money Managers Short (Symbol: X.US.ZSEMMSHT).
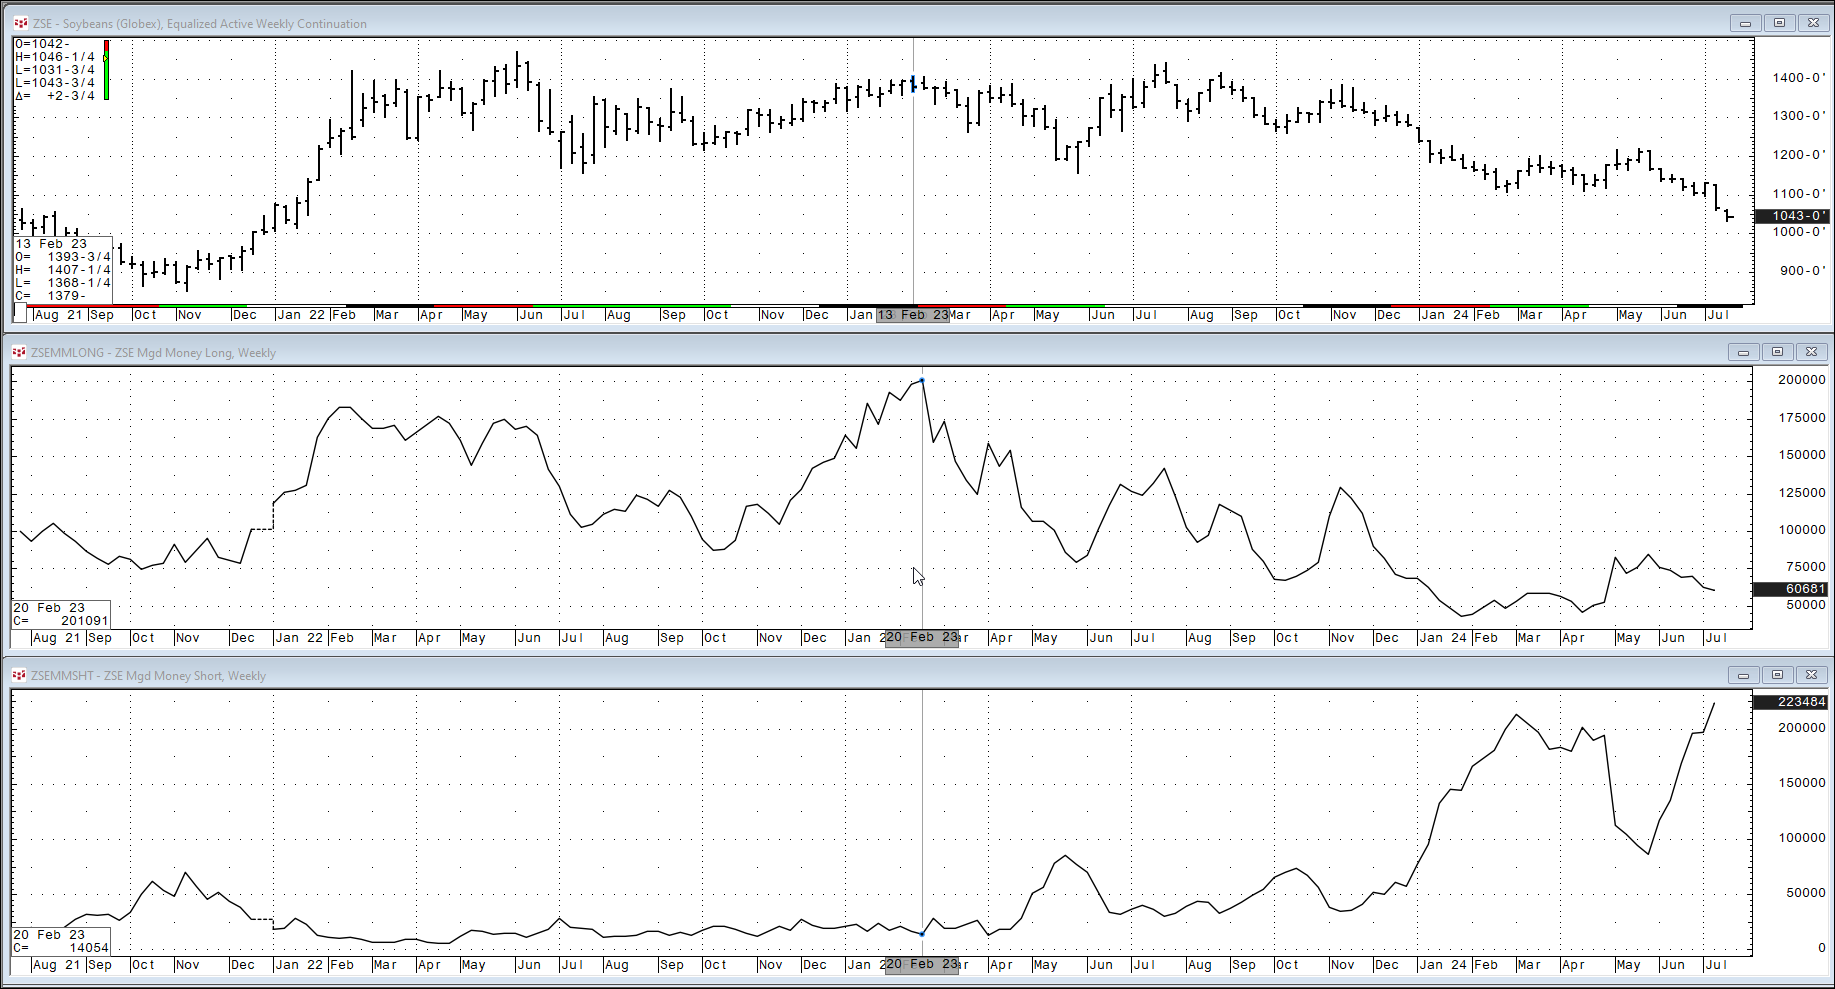
The cursor set across all three charts where the Money Managers Long positions peaked and a few months later the Money Managers Short positions began to climb. To the very right the Money Managers' long positions are low, the Money Managers' short positions are very high, and the Soybean market has been in a down trend for nearly a year.
This may be a simple one-time example easily pointed out with the benefit of hindsight.
To avoid the "benefit of hindsight" the data can be normalized by the use of this formula: Using a lookback period, subtract the lowest low from the current value, and then divide the difference by the range, (where the range is the highest high - lowest low).
The result is a percentage measurement of where the current value is in the lookback range of the values. CQG offers this calculation as a study: Fast Stochastics (FStoch)
The Fast stochastics (with a lookback period of 26 week) is applied to all three weekly charts. However, the interest is the two COT studies. Comparing the two COT studies and their respective Fast Stochastics plots indicates there is an inverse relationship.
Point A in the above image the Fast Stochastics hits 100 indicating the Money Managers Long position is the highest in the last six months. Point B in the above image the Fast Stochastics crosses below 50 indicating the Money Managers Long position has dropped to below 50% of the range in the last six months. Point C and D detail the same observations.
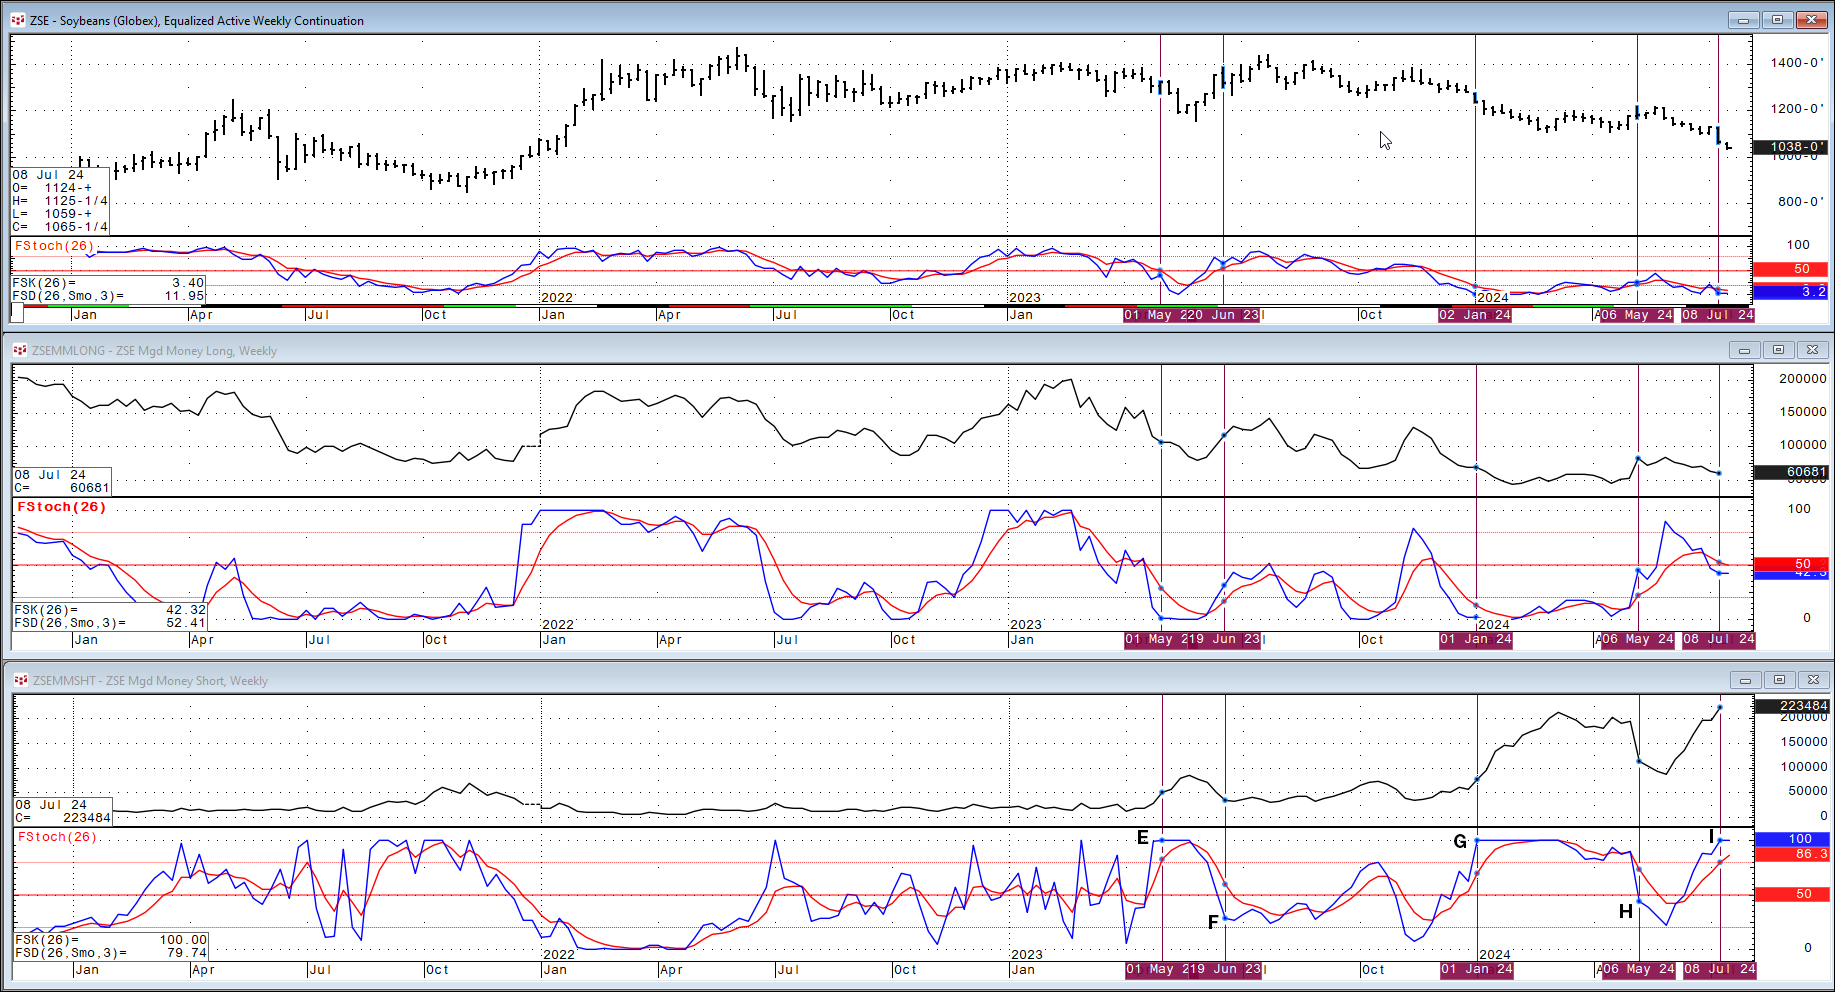
Point E in the above image the Fast Stochastics hits 100 indicating the Money Managers Short position is the highest in the last six months. Point F in the above image the Fast Stochastics crosses below 50 indicating the Money Managers Short position has dropped to below 50% of the range in the last six months. Point G and H detail the same observations. Finally, Point I shows that the Fast Stochastics has hit 100 again.
Tracking the Money Managers Long and Money Managers Short positions looks interesting. The Fast Stochastics study is helpful for providing a frame of reference comparing the latest value to the range of values.
Another possibly useful tool when analyzing the Soybean market is CQG's Season Overlay study. This study is very popular with analysts and traders in the agricultural markets because of the annual nature of planting, growing and harvesting crops.
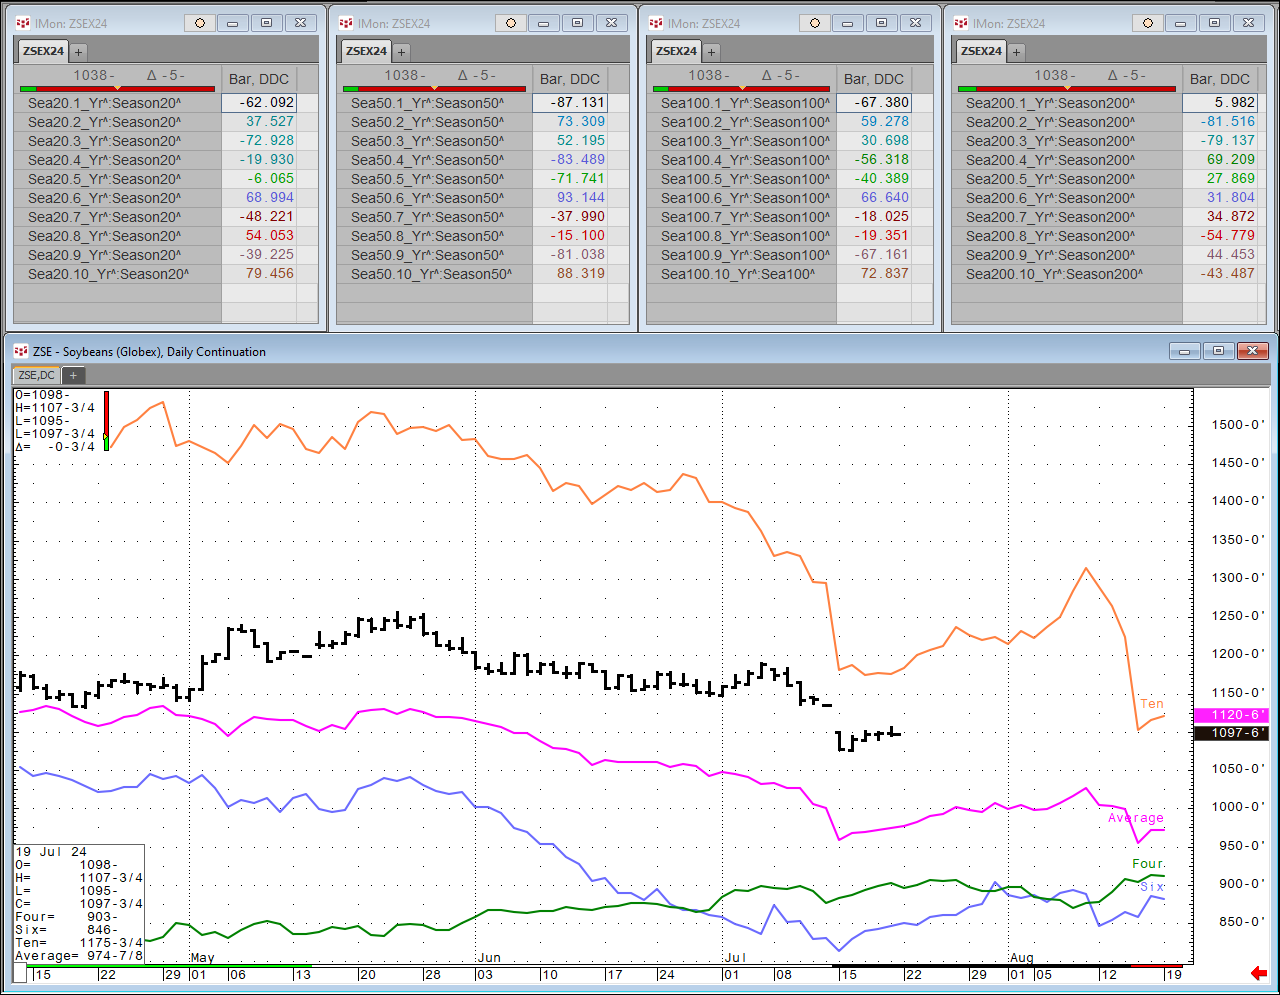
The post includes a downloadable CQG PAC which installs a page that includes the chart and there are four CQG Instrument Monitors. The Instrument Monitor tracks a single instrument across multiple timeframes and chart types with multiple studies and indicators in a spreadsheet view. In this case the instrument monitors are performing correlation analysis over set lookback periods for each historical year compared to the current year.
This post discussed using the Money Managers Long and Money Managers Short positions as an indicator of the trend. Afterall, Money Managers need to be accurate to stay in business. However, there is no magical study that can promise profits.
There may be ways to improve the use of the Fast Stochastics study, such as lengthening or shortening the lookback range.
Requires CQG Integrated Client Version 2020 or CQG QTrader Version 2020 or higher.