
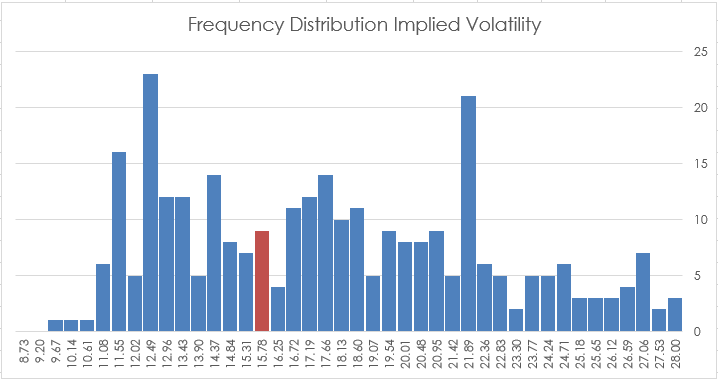
CQG IC and QTrader offer two studies that track volatility: Implied Volatility and Historical Volatility. This post details each study and provides an Excel spreadsheet for tracking the two.
… more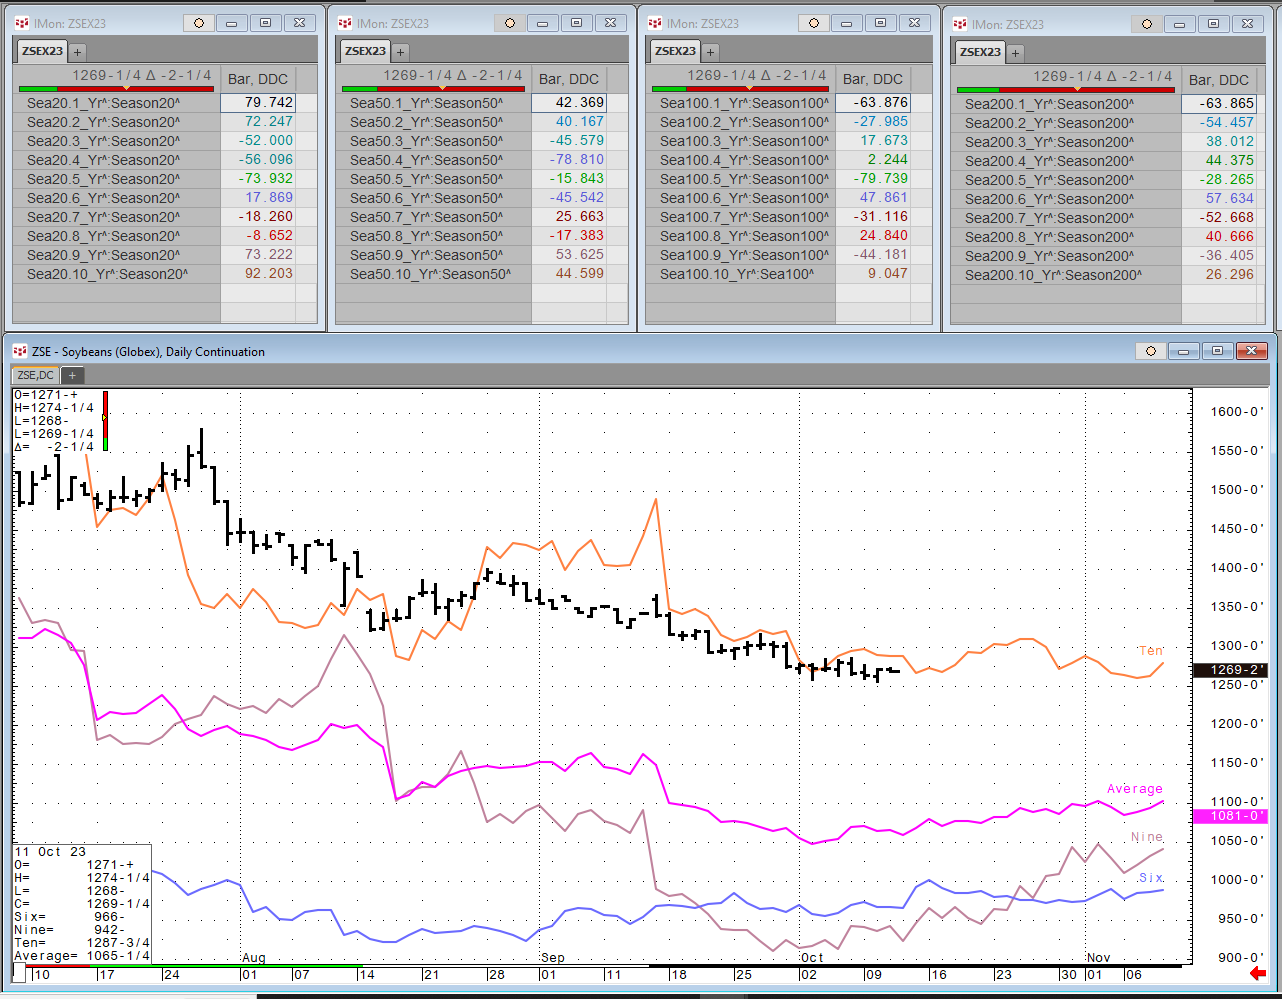
Each Wednesday this article will be updated with the current seasonal study using CQG's Seasonal analysis applied to the Soybean, Wheat and Corn markets. You can download the CQG pac providing the… more
Various improvements and bug fixes.
General/QuotesAdded delivery end date to as a column in QSSStrategy builder usability improvementsTrading/ReportingAdded 'Type' column to Positions… more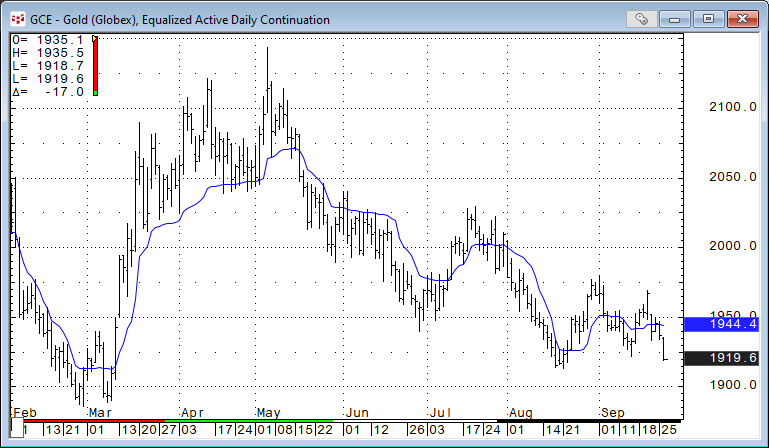
The Adaptive Moving Average (AMA) was developed by American quantitative financial analyst and author Perry J. Kaufman. The AMA study is like the exponential moving average (EMA), except the AMA… more
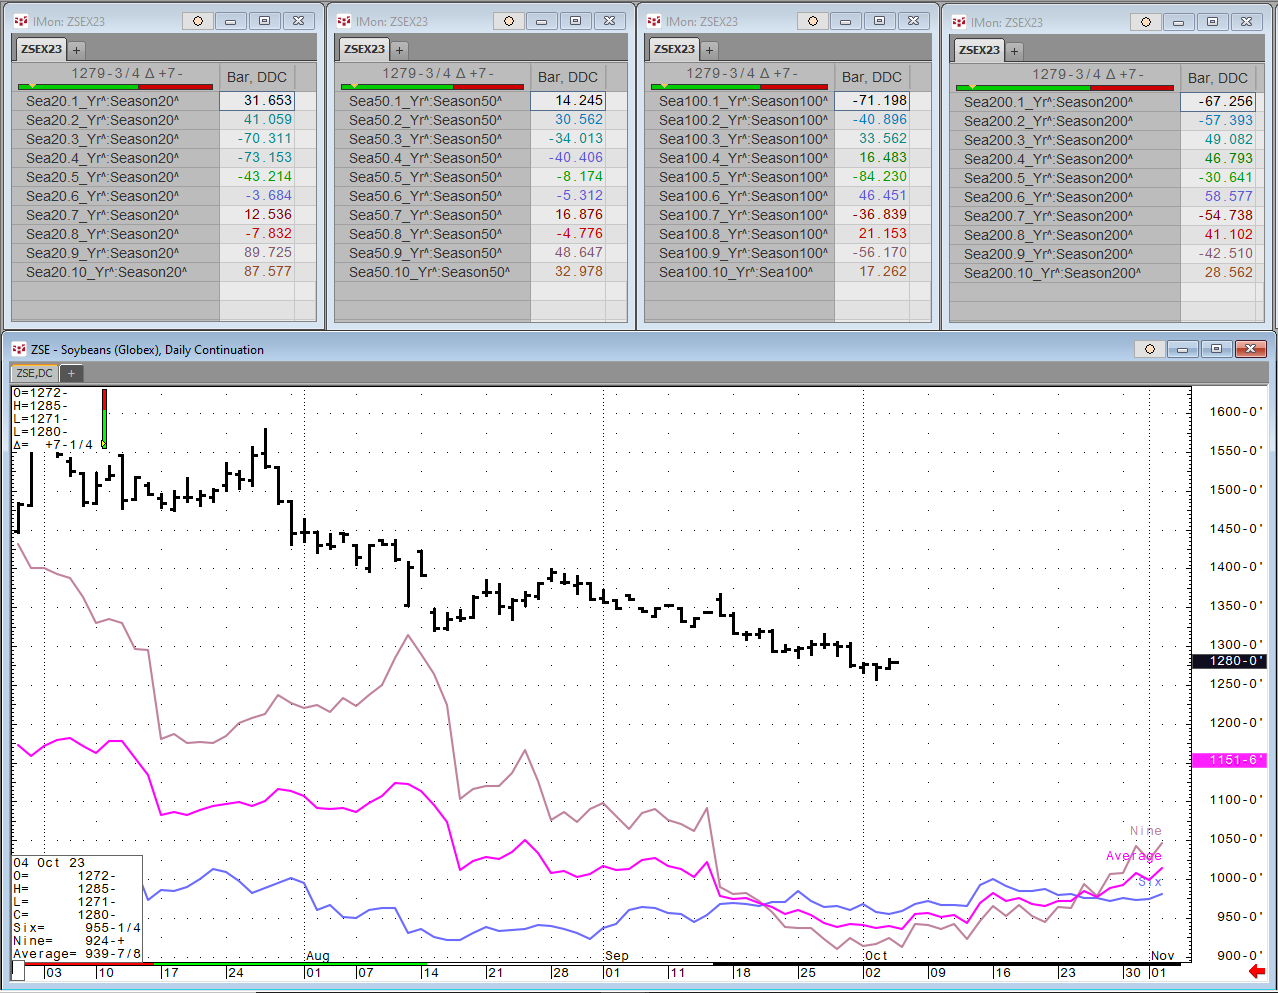
Each Wednesday this article will be updated with the current seasonal study using CQG's Seasonal analysis applied to the Soybean, Wheat and Corn markets. You can download the CQG pac providing the… more
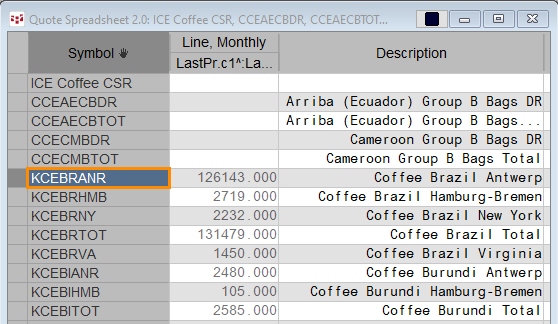
Certified stocks are bags of coffee that have been graded by the ICE exchange by ICE approved graders and are warehoused in exchange approved warehouses around the world. ICE reports the current… more
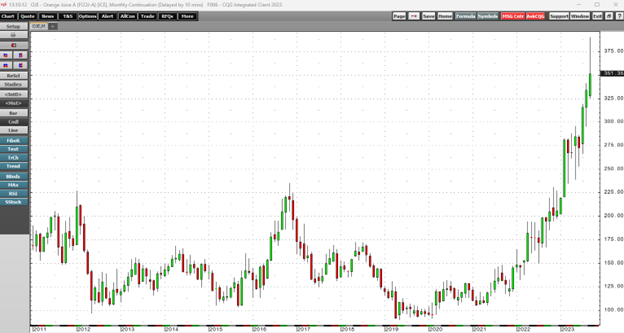
The raw material markets edged higher in Q3. The commodity asset class consisting of 29 primary commodities traded on U.S. and U.K. exchanges moved 1.91% higher in Q3 2023. Over the first nine… more
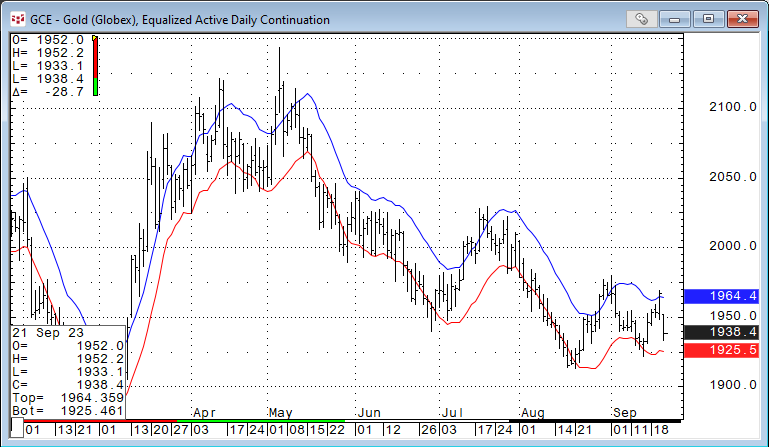
Technical analysts and technical based traders apply various studies to price data, such as a moving average, to smooth the price action. The goal is to filter the moment-to-moment price action,… more
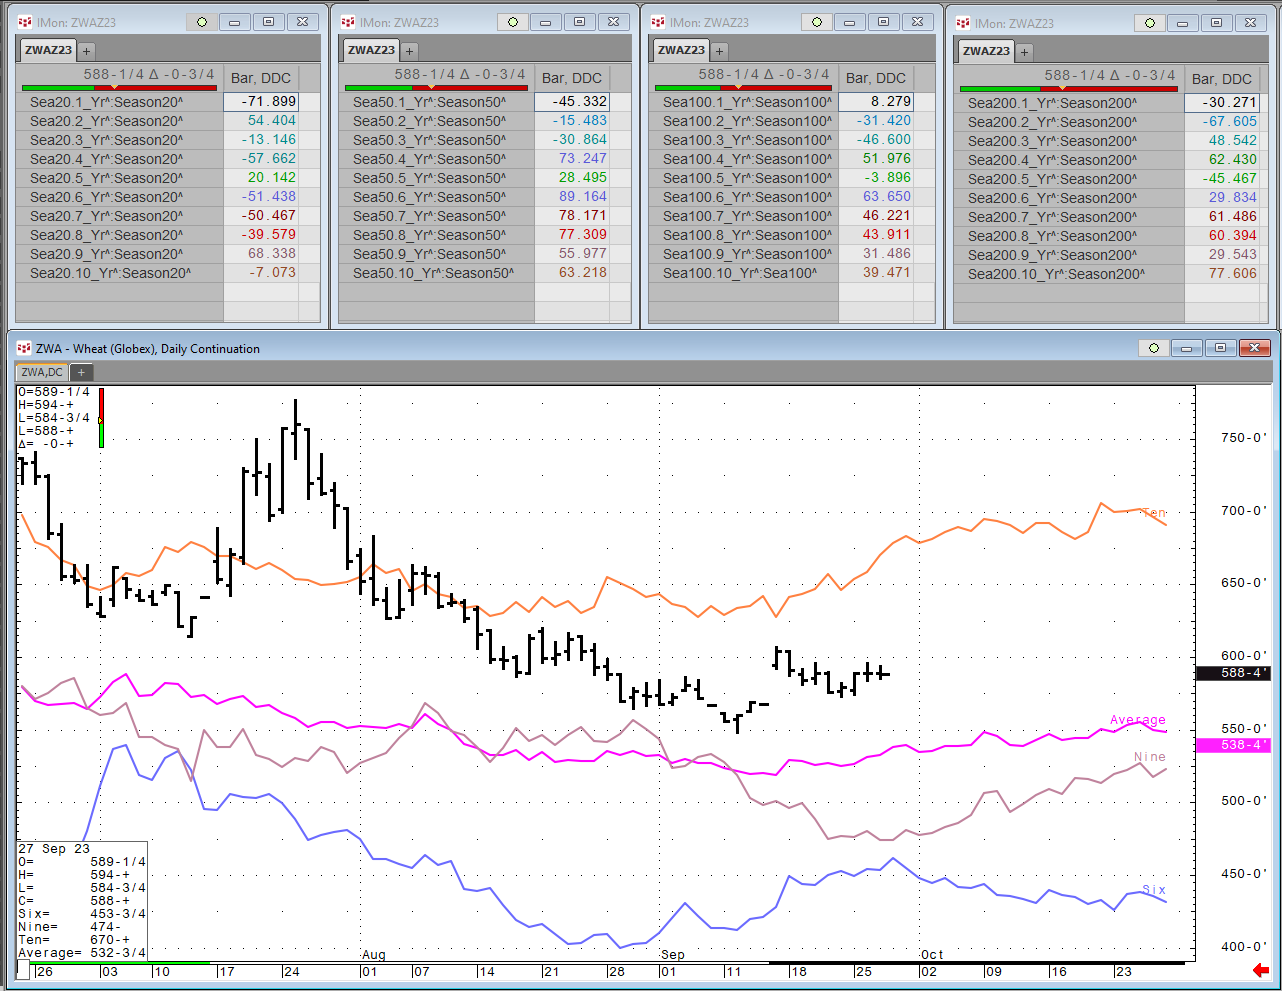
Each Wednesday this article will be updated with the current seasonal study using CQG's Seasonal analysis applied to the Soybean, Wheat and Corn markets. You can download the CQG pac providing the… more
Louis-Vincent Gave - CEO. Louis-Vincent Gave co-founded GaveKal in 1999 with his father Charles and Anatole Kaletsky. GaveKal started as an independent research firm and evolved in 2005 to include… more