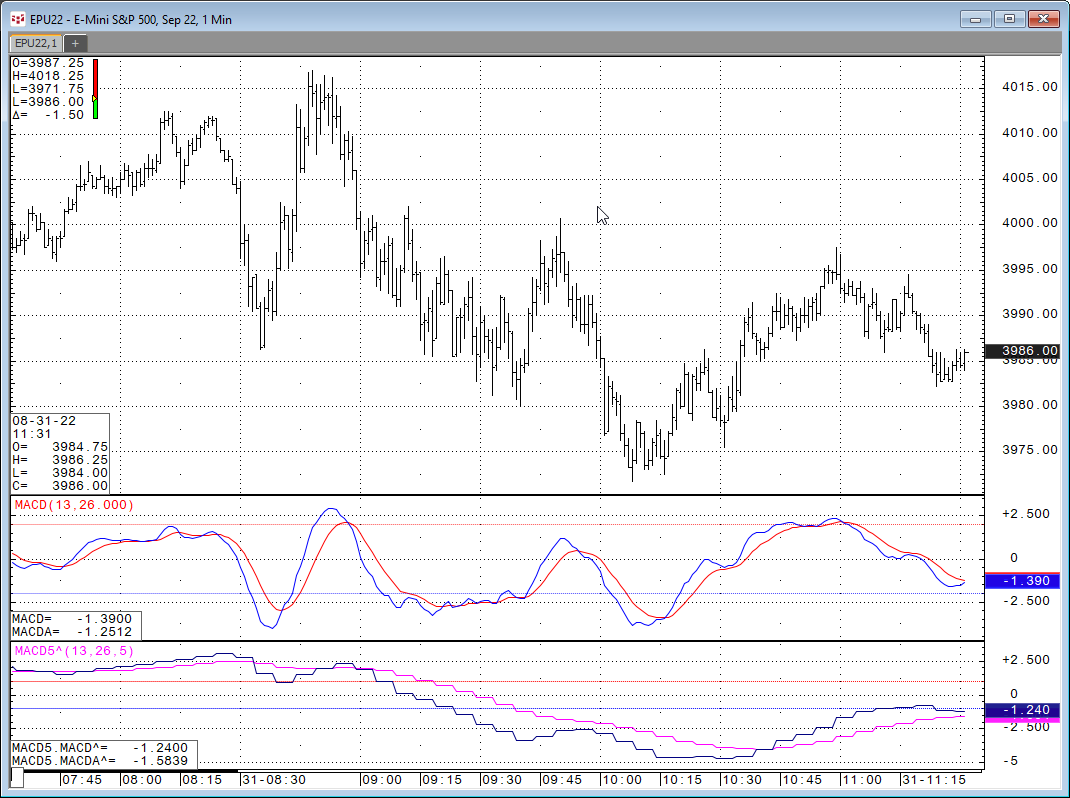
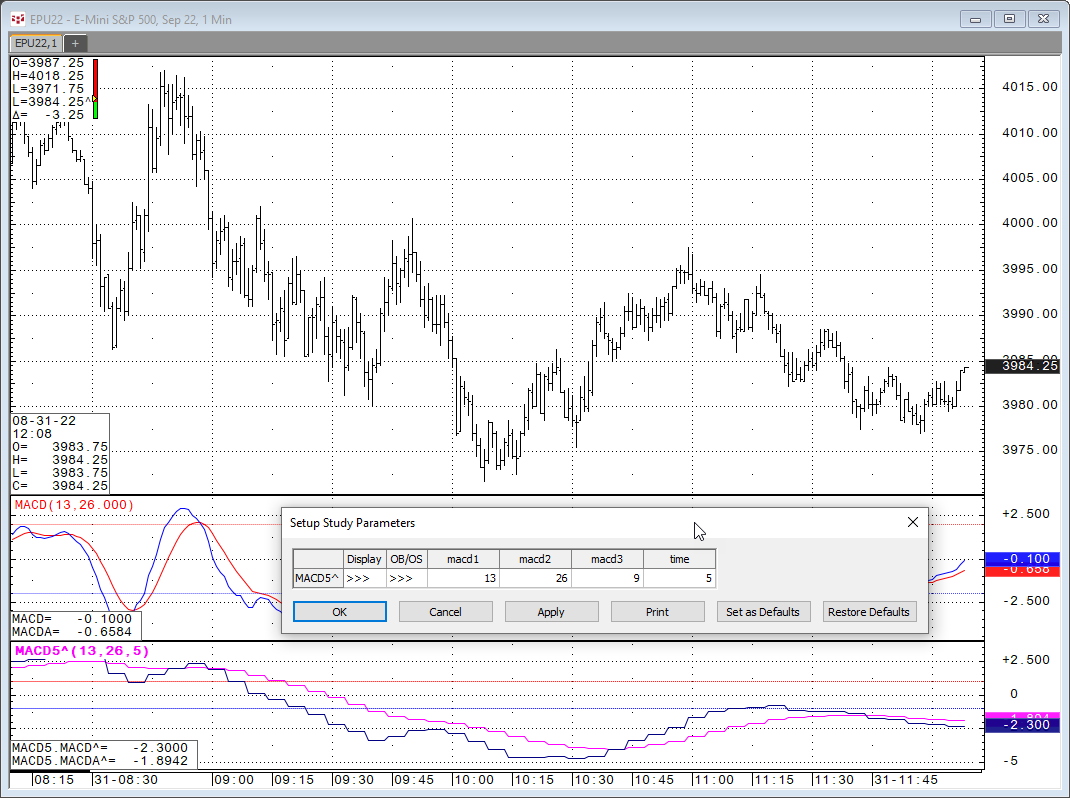
Let's say you want to look at a study on a chart but you want the study to use a different time frame than the time frame for the bars. For example, the MACD Study on a 1-minute chart using 5-minutes for the MACD study as shown below (you can only view higher time frames). The top study is the MACD study using 1-minute bars and the bottom MACD study is using 5-minute bars for the calculation.
Here, courtesy of CQG Product Specialist Helmut Mueller, are the steps to creating this custom time frame study.
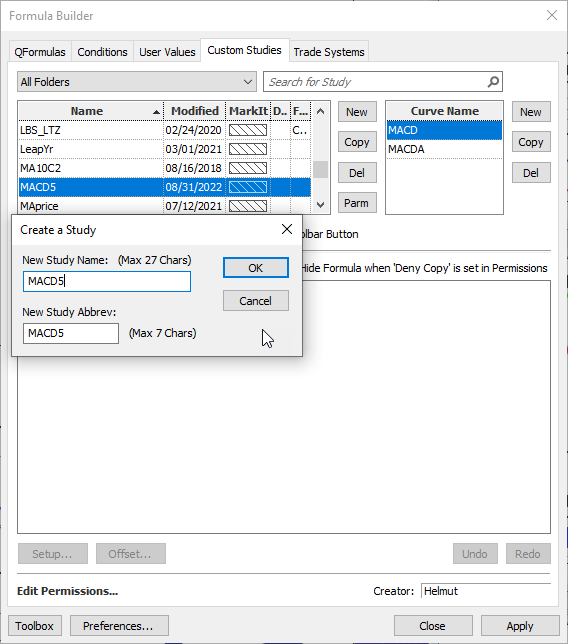
Click on Formulas and Select Custom Studies. Create a new study named, for example, MACD5. Rename the curve name to MACD
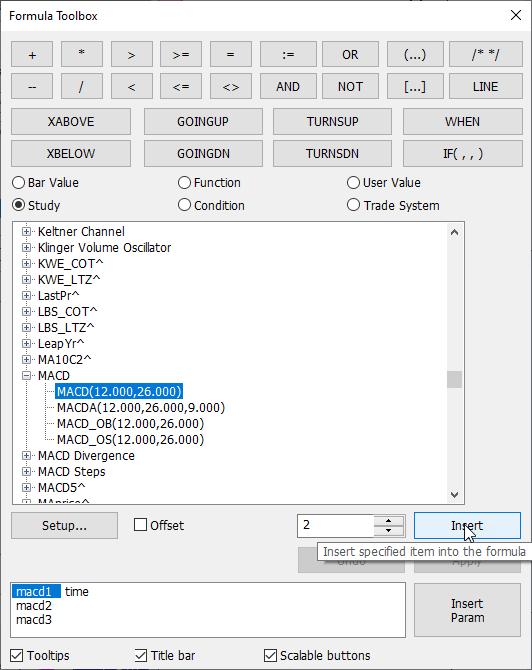
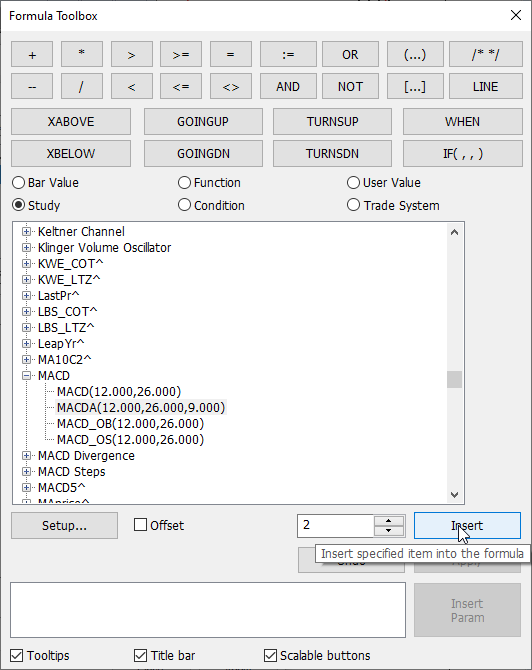
Search for MACD under studies in the toolbox and click insert.
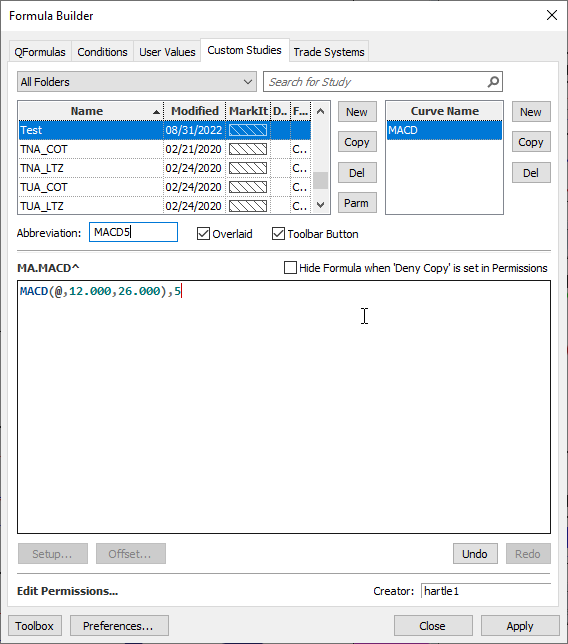
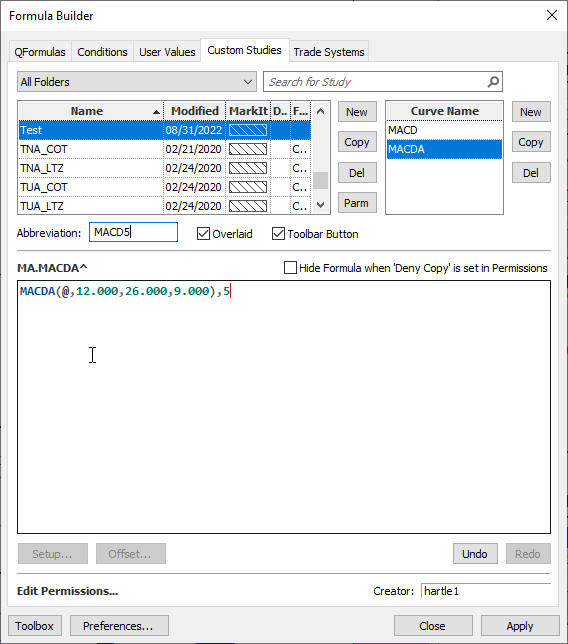
After you inset the study add a ,5 at the end of the code.
This forces the MADC Line to be calculated off 5 minute data. The second MACDA line needs to be added. Select New and name the curve MACDA. Insert the MACDA from the toolbox.
Add the ,5 at the end of the code.
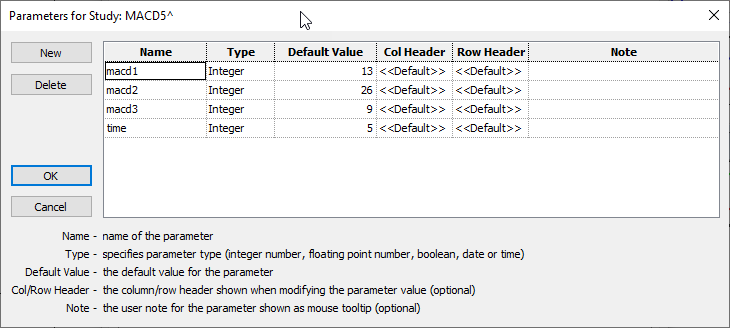
Click on the Parm button to name and set parameters.
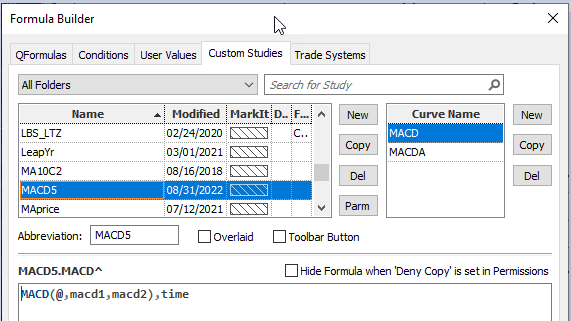
After the parameters are setup then change the hard coded parameters in the two studies to use the configured parameters.
For more information check out the Help file:
https://help.cqg.com/cqgic/22/#!Documents/creatingcustomstudies.htm
At the bottom of the post is a downloadable CQG PAC file for use with CQG IC or QTrader.
