CQG IC and QTrader offer the Candlestick Formations study.
The Candlestick Formations study is a collection of conditions. Candlestick formations appear as overlays on the chart in the colors selected in parameters.
Candlestick Formations consist of 1-, 2-, or 3-bar patterns. These patterns are described in Steve Nison's Japanese Candlestick Charting Techniques (Prentice Hall, 2001).
When applied to a chart text symbols appear either at the top or bottom of each formation (bearish at top, bullish at bottom).
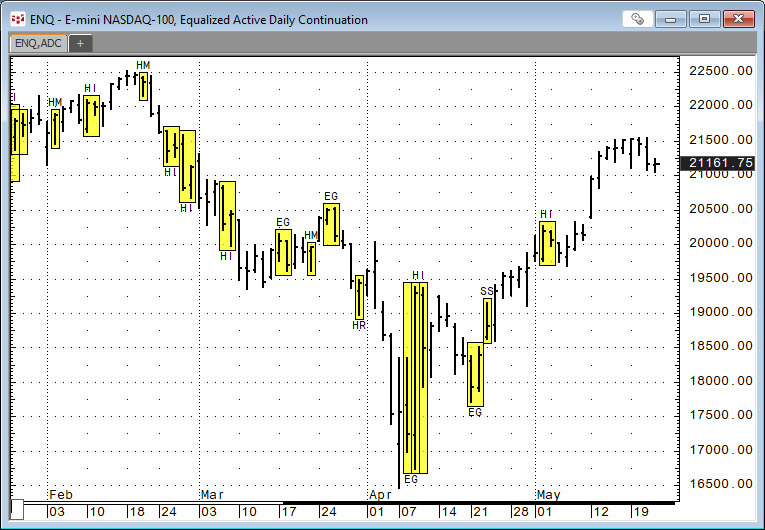
The study can be applied to any time frame, such as 5-minute bars.
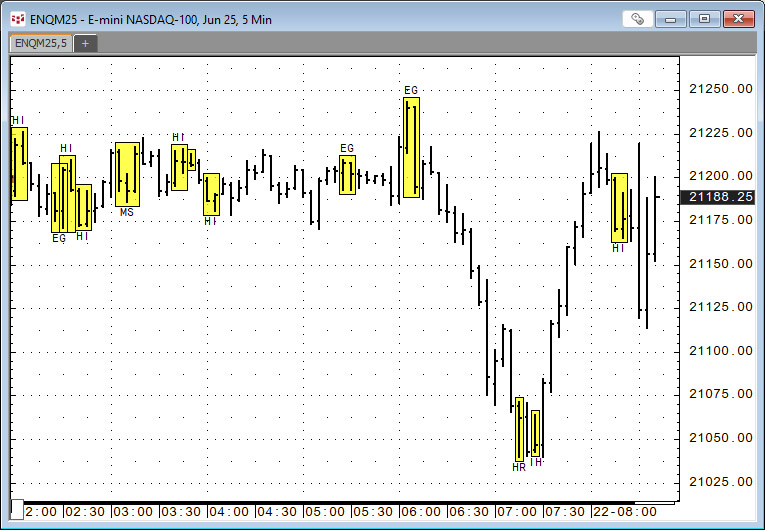
Double Doji appears at the top, and the question mark following it indicates it's neither bearish nor bullish. The Double Doji represents a condition in which the open and close for the first session are the same, followed by a second session in which the open and close are again the same.
Names of the Formations
1-bar formations:
| 2-bar formations:
| 3-bar formations:
|
The Help file has a table detailing each formation.
For example:
| Formation (symbol) | Description |
|---|---|
| Dark Cloud (DC) | Bearish. Represents the opposite of Piercing Line. Established by two criteria:
Occurs after an up-trend or, at times, at the top of a congestion band. This, however, doesn't affect the highlighting of the formation in any way. Does not require Trend or Range parameter. |
The parameters for the Candlestick Formations study allow you to toggle on or off which formations to highlight. The "Trend" parameter is the number of bars considered in the trend indicator. The "Range" parameter is the average length of the candlestick body as determined by number of previous bars.

Further reading and testing of Candlestick Formations may yield insight into patterns that should be part of a trading system.
Requires CQG Integrated Client or CQG QTrader.