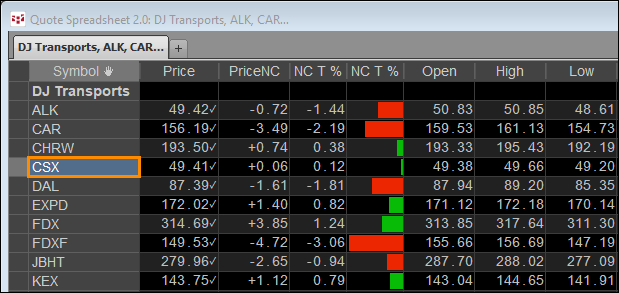
This post offers a downloadable CQG PAC for installing the DJT and DJU Page in CQG IC or QTrader. The page details the current session's market performance of the constituents of the two averages… more
CQG PAC Files
From their website:
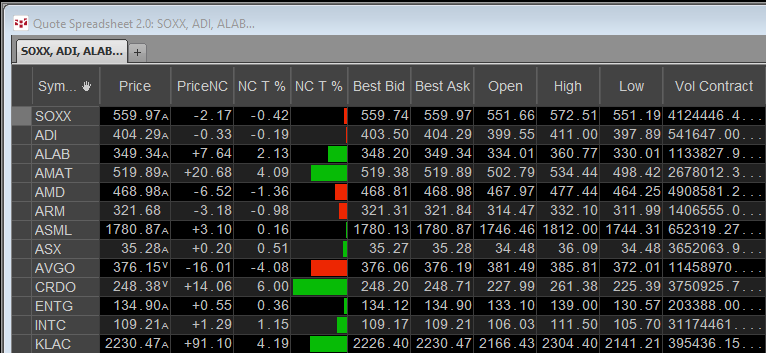
The iShares Semiconductor ETF seeks to track an U.S. equity index of companies in the semiconductor sector. The fund offers a way to invest in companies across the… more
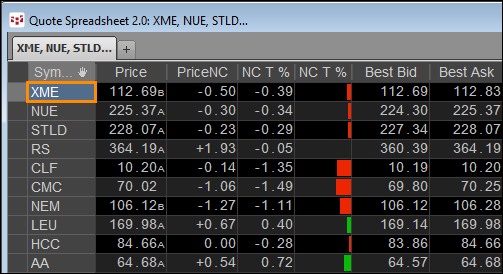
This post details a CQG PAC that is a CQG page that can be downloaded and installed to track the day’s performance of the holdings of the SPDR® S&P® Metals & Mining ETF.
From The… more
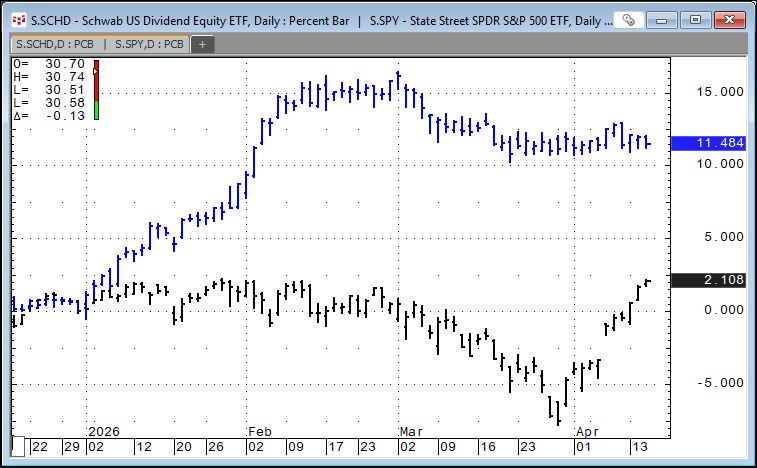
This post details a CQG PAC that is a CQG page that can be downloaded and installed to track the day's performance of the holdings of the Schwab U.S. Dividend Equity ETF (Symbol: SCHD).
From… more
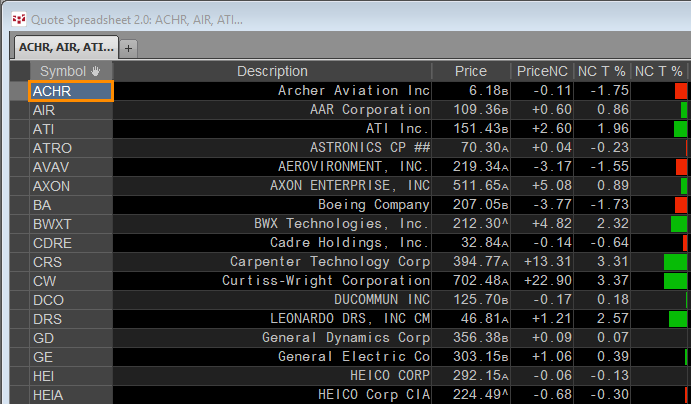
This post details a CQG PAC that can be downloaded and installed to track the day's performance of the holdings of the iShares U.S. Aerospace & Defense ETF (Symbol: ITA)
From the iShares… more
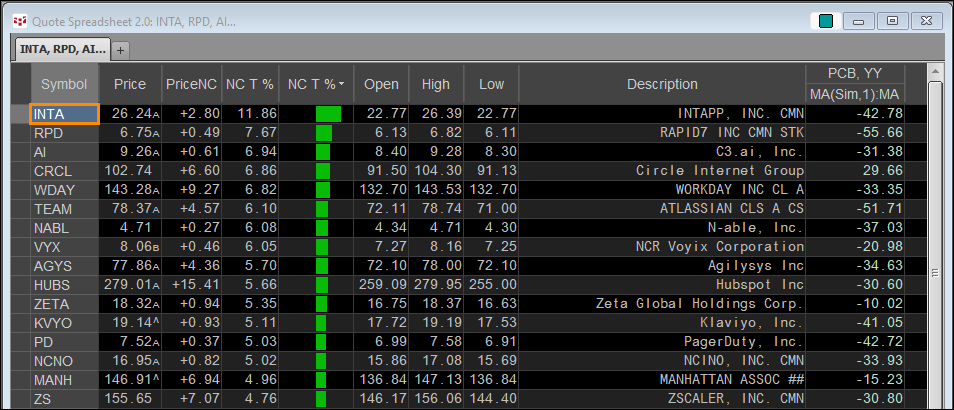
This post details a CQG PAC that can be downloaded and installed to track the day's performance of the holdings of the iShares Expanded Tech-Software Sector ETF (Symbol: IGV).
From the… more
In Mr. Ehlers Book “Cybernetic Analysis for Stocks and Futures” the “Leading Indicator” was introduced. The goal of this study was to smooth the price action while not having the lag by the study… more
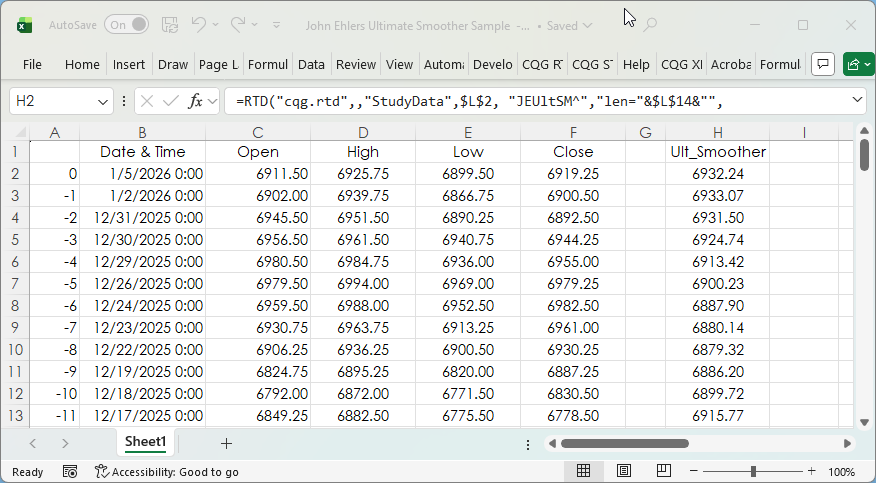
This post details the steps to pulling custom study values into Excel using RTD formulas. First, an overview of RTD formulas and parameters.
When CQG IC or QTrader are installed, a DLL… more
The post CQG Primer: The Ultimate Smoother detailed a study developed by John Ehlers. You can find a detailed description of the Ultimate Smoother on the MESA Software website.
This post… more
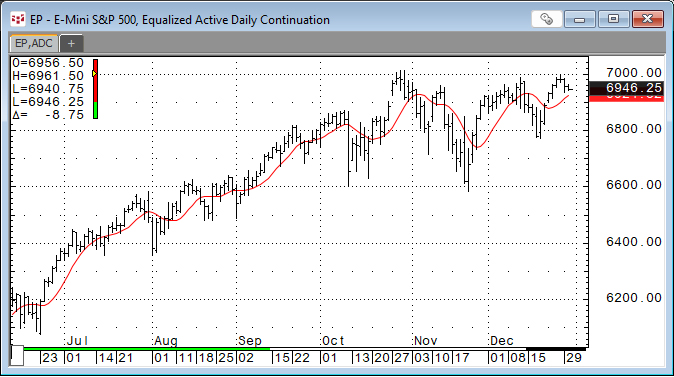
John Ehlers developed the Ultimate Smoother study. https://www.mesasoftware.com/TechnicalArticles.htm The study is a two-pole low-pass digital filter designed to smooth price data while… more