This correlation dashboard gives you sparklines to see the most recent changes in the correlation. Enter the symbols down the left-hand column. Change the look back period and the timeframe at the bottom.
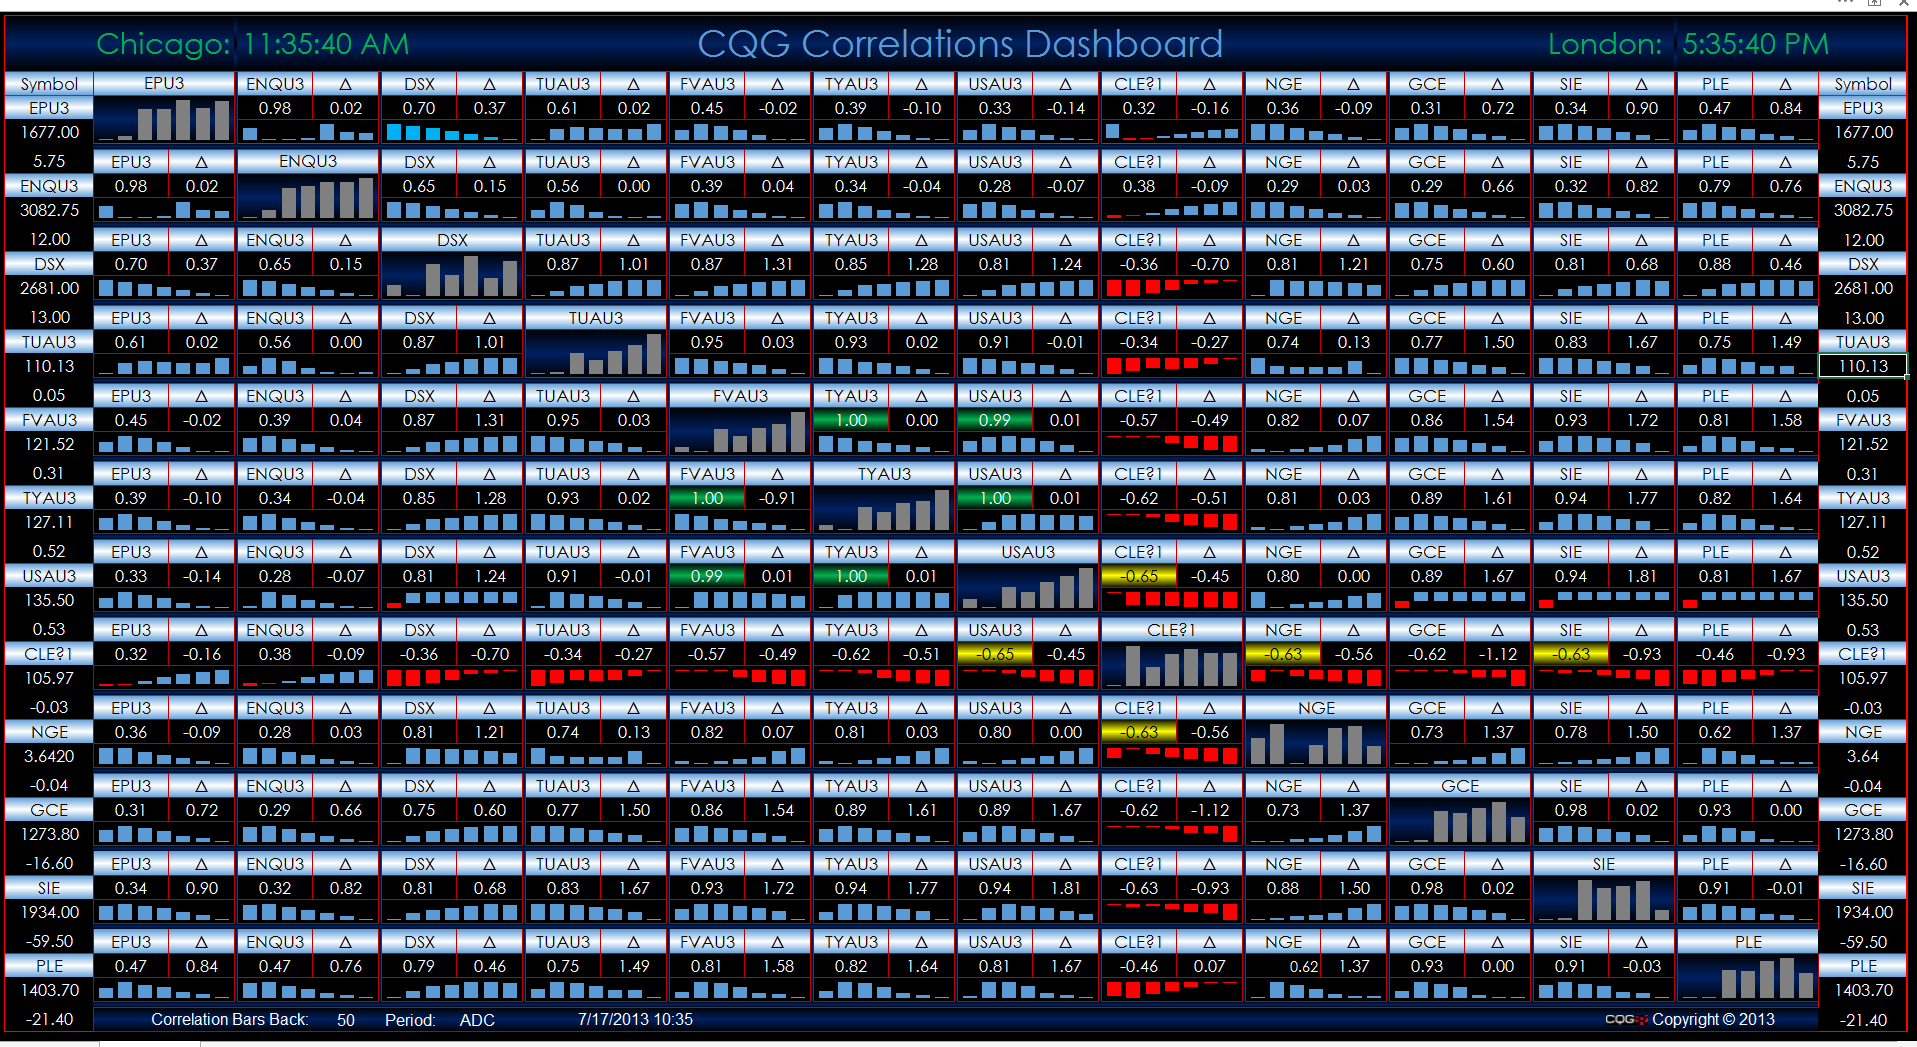
Requires Microsoft Excel 2010 and CQG IC.
This correlation dashboard gives you sparklines to see the most recent changes in the correlation. Enter the symbols down the left-hand column. Change the look back period and the timeframe at the bottom.
Requires Microsoft Excel 2010 and CQG IC.
Trading and investment carry a high level of risk, and CQG, Inc. does not make any recommendations for buying or selling any financial instruments. We offer educational information on ways to use our sophisticated CQG trading tools, but it is up to our customers and other readers to make their own trading and investment decisions or to consult with a registered investment advisor. The opinions expressed here are solely those of the author and do not reflect the opinions of CQG, Inc. or its affiliates.