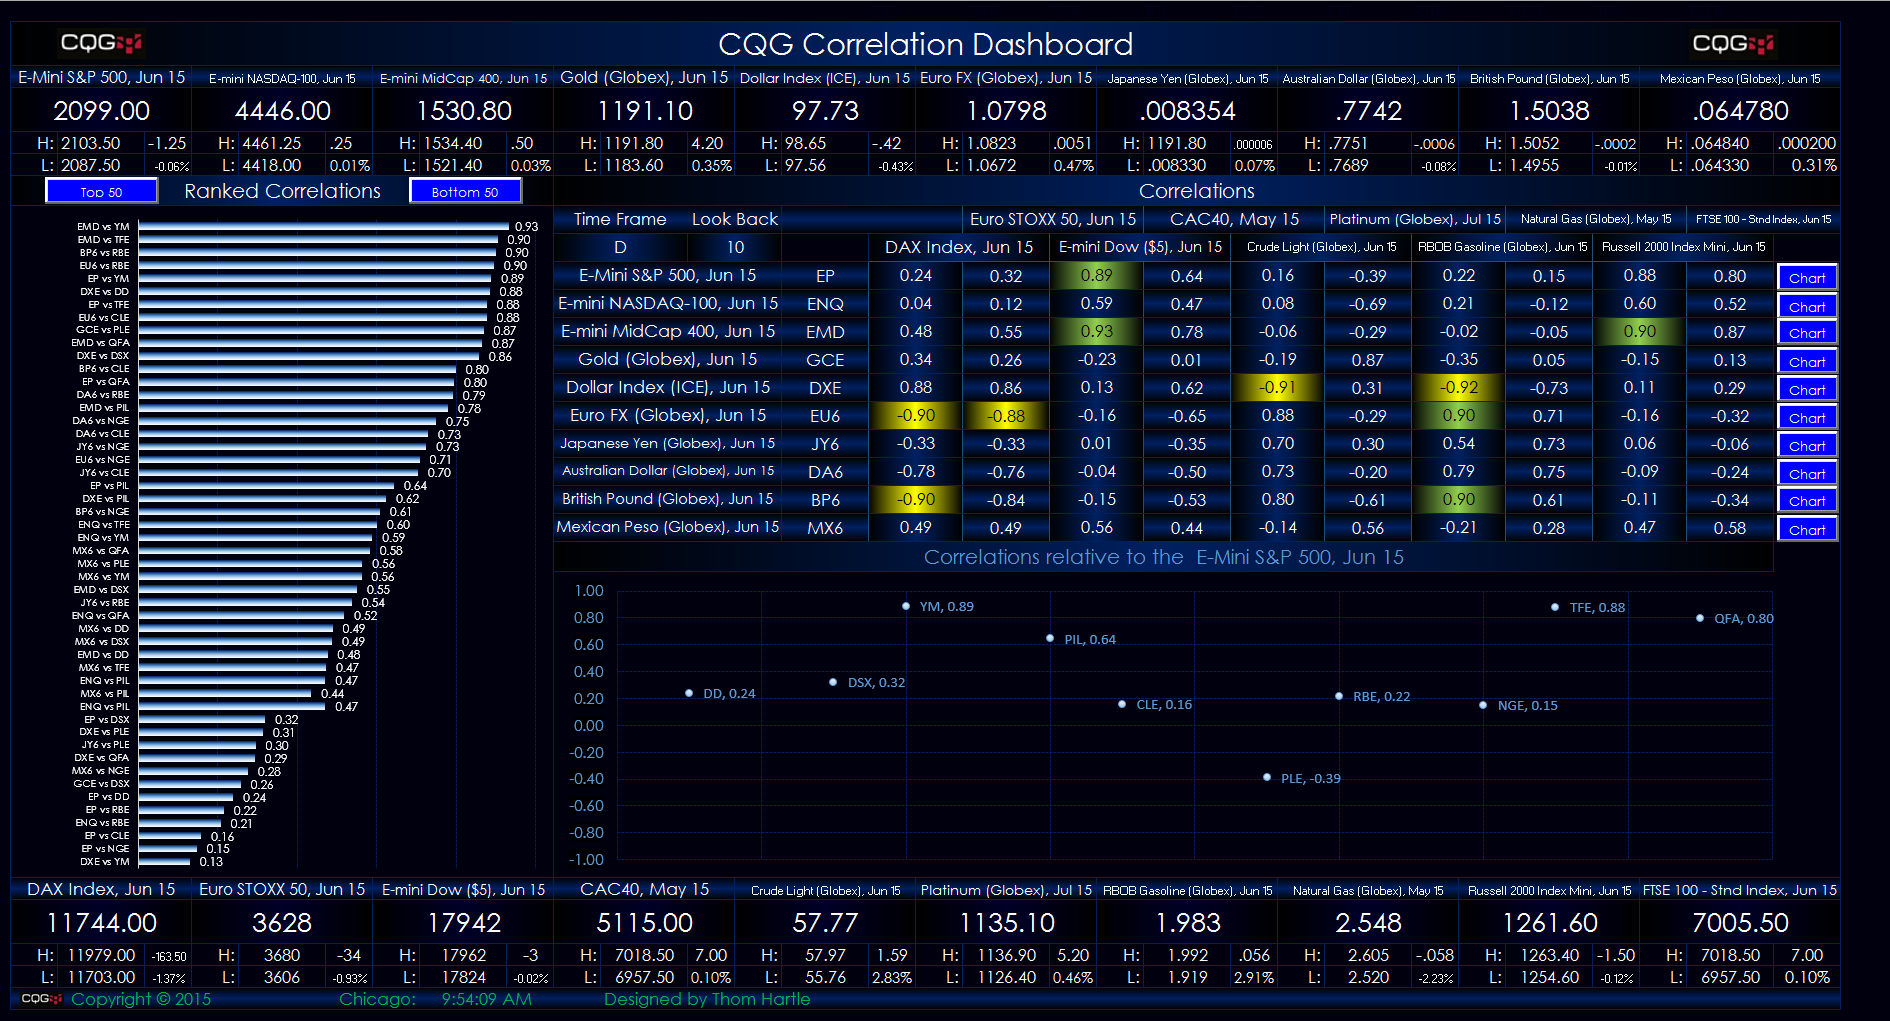
This Microsoft Excel® spreadsheet presents a 10-by-10 correlation matrix. In addition, a dynamically ranked view of the correlations from the 10-by-10 correlation matrix is displayed as histogram… more
Workspaces
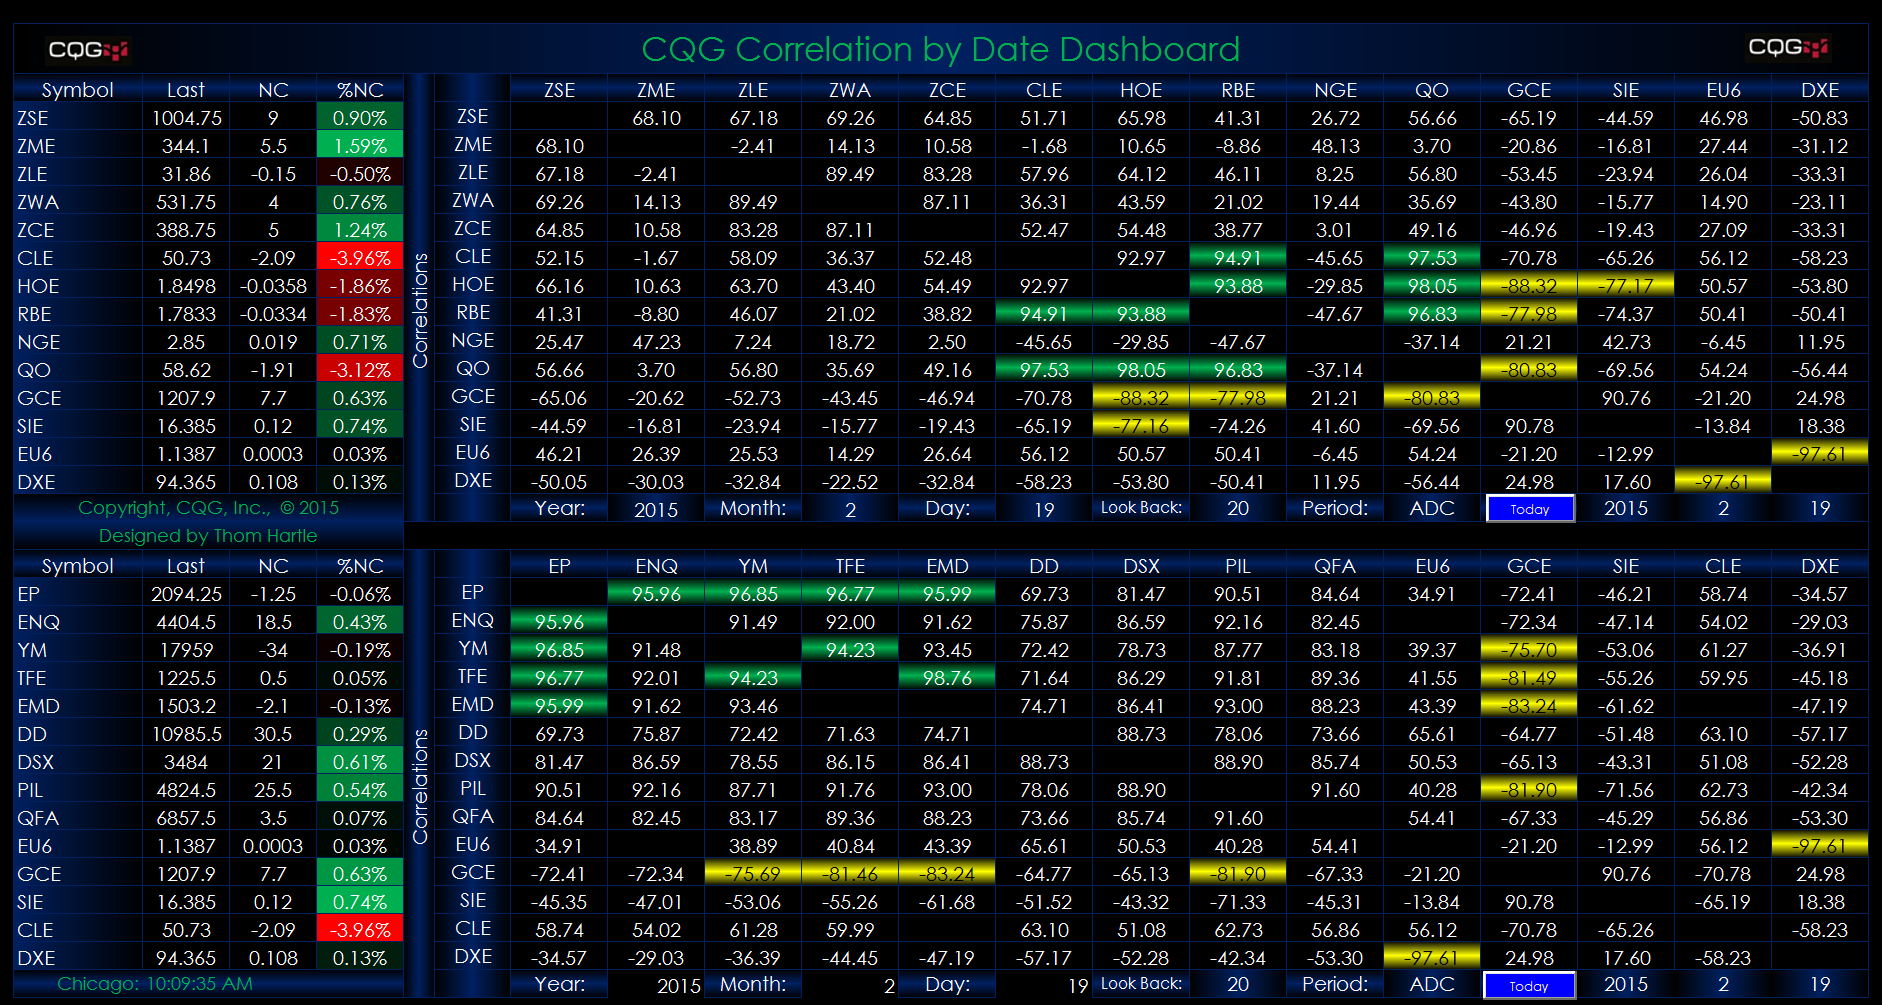
This Microsoft Excel® spreadsheet presents two views of current market data and two correlation matrices. The market data sections use the symbols entered into the first column. The last quoted… more
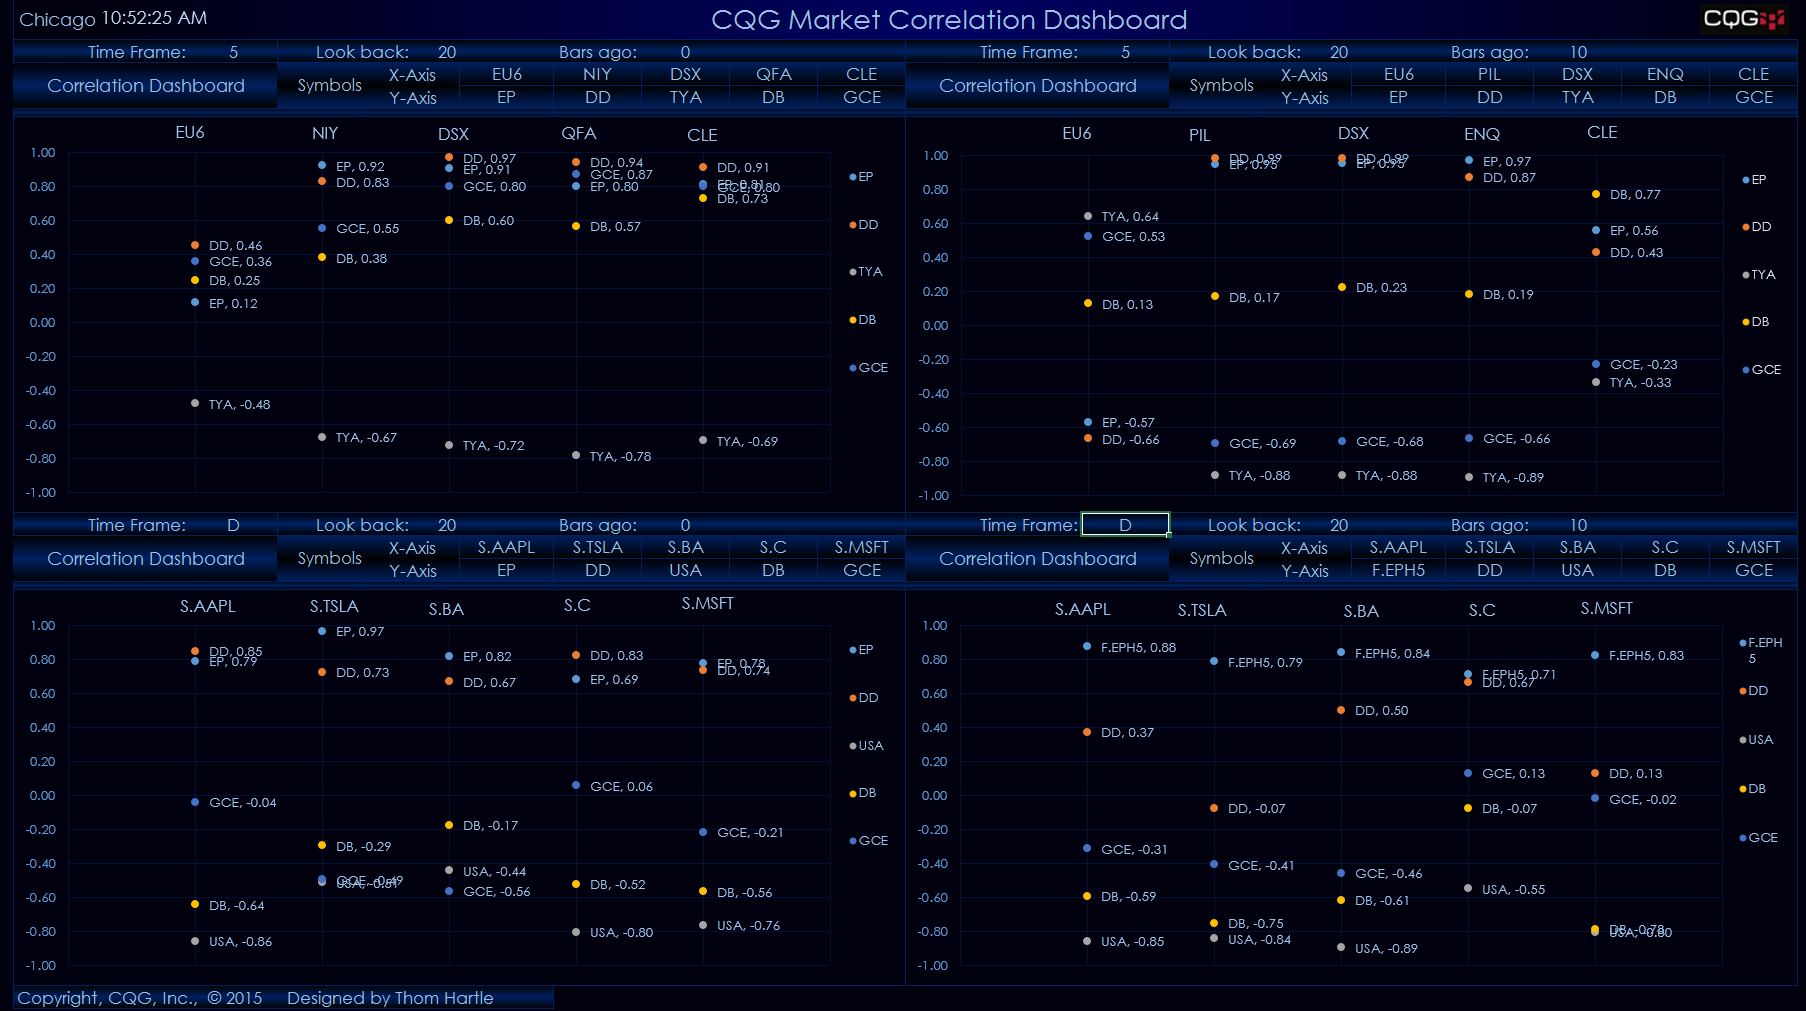
This Microsoft Excel® spreadsheet uses a quadrant format to display correlations. For each quadrant, you can enter five symbols for the horizontal axis and five symbols for the vertical axis. You… more