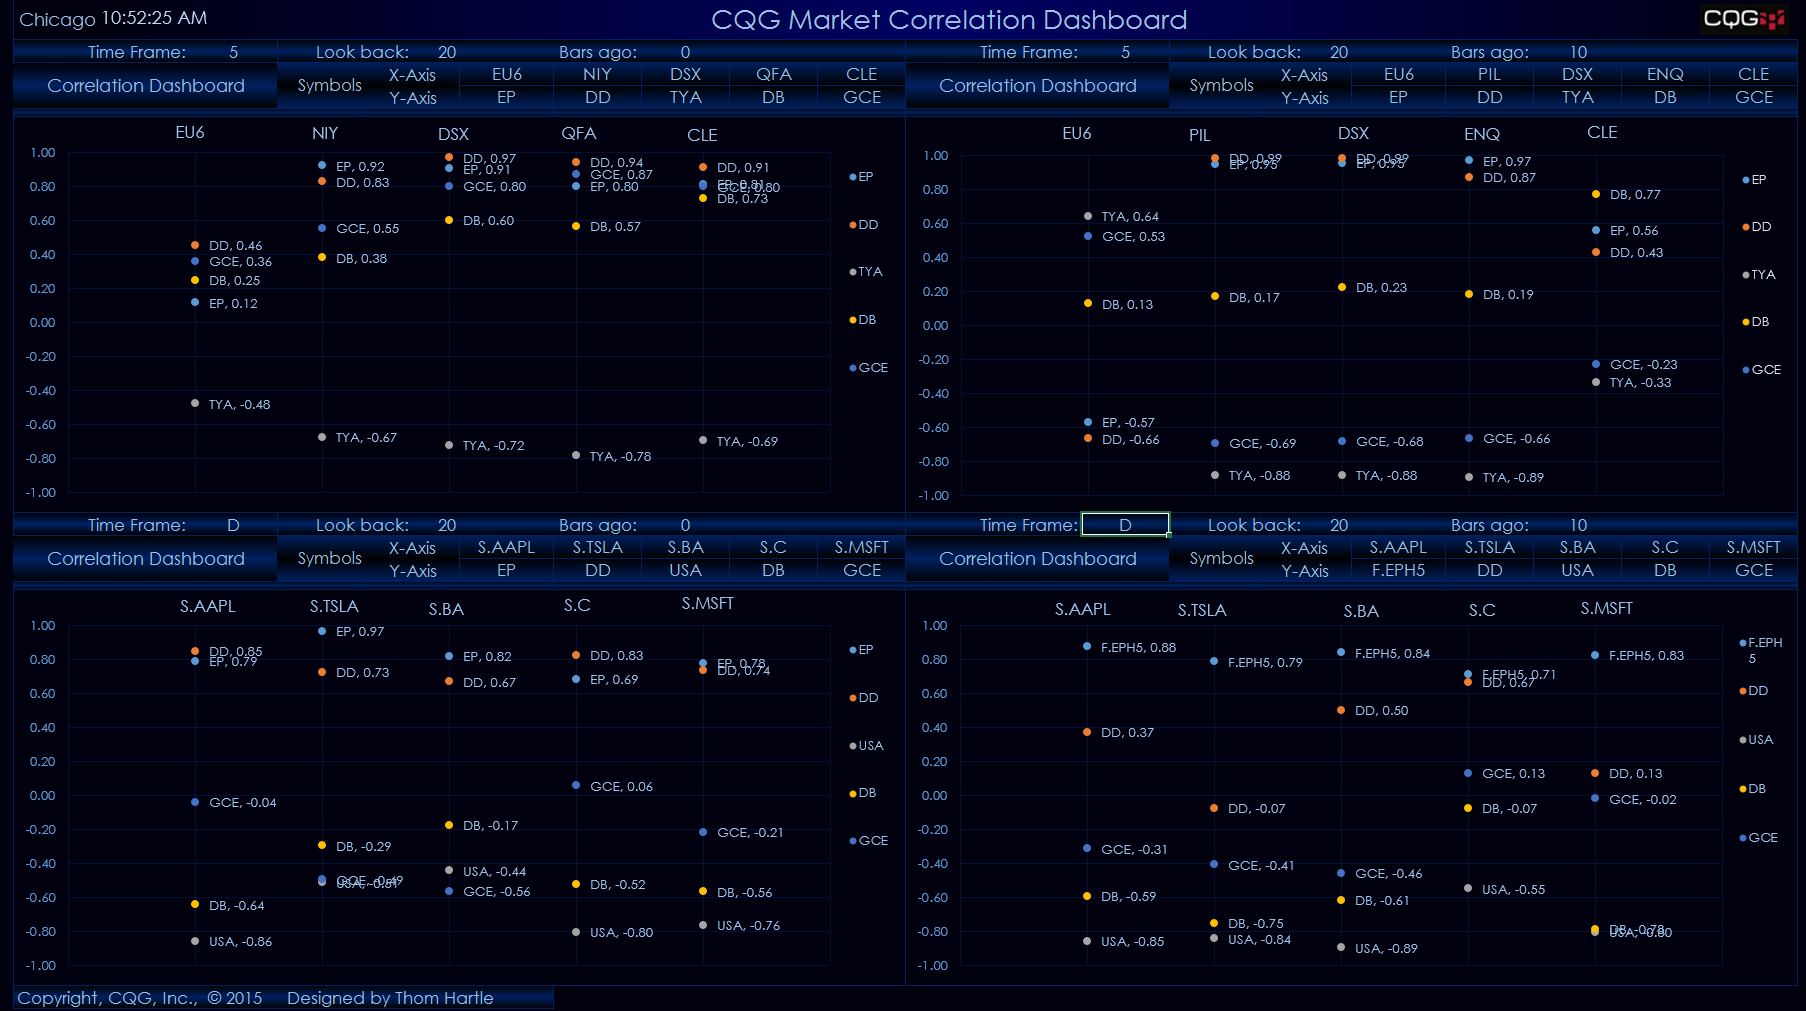
This Microsoft Excel® spreadsheet uses a quadrant format to display correlations. For each quadrant, you can enter five symbols for the horizontal axis and five symbols for the vertical axis. You can enter the time frame, the lookback period, and bars ago for each quadrant. For example, you could use the same set of symbols for each quadrant and two different time frames, such 30-minute and daily bars for the two left-hand quadrants, and a 10-period lookback for the correlation. Then use the same symbols and parameters and enter 10 for bars ago. Now, compare the two left-hand quadrants to the two right-hand quadrants to see how the correlation changed from 10 bars ago.
Please review this document for higher time frames using continuation charts: http://help.cqg.com/cqgic/15/#!Documents/enteringsymbolswithc3.htm.
Please note that the equalize closes setting for continuation charts is true by default.
Requires CQG Integrated Client or CQG QTrader, data enablements for all symbols displayed in this spreadsheet, and Excel 2010 or more recent.