This Microsoft Excel® spreadsheet presents two views of current market data and two correlation matrices. The market data sections use the symbols entered into the first column. The last quoted price and net change are displayed. In addition, the heat-mapped percent net change indicates the strongest and weakest markets for the current session.
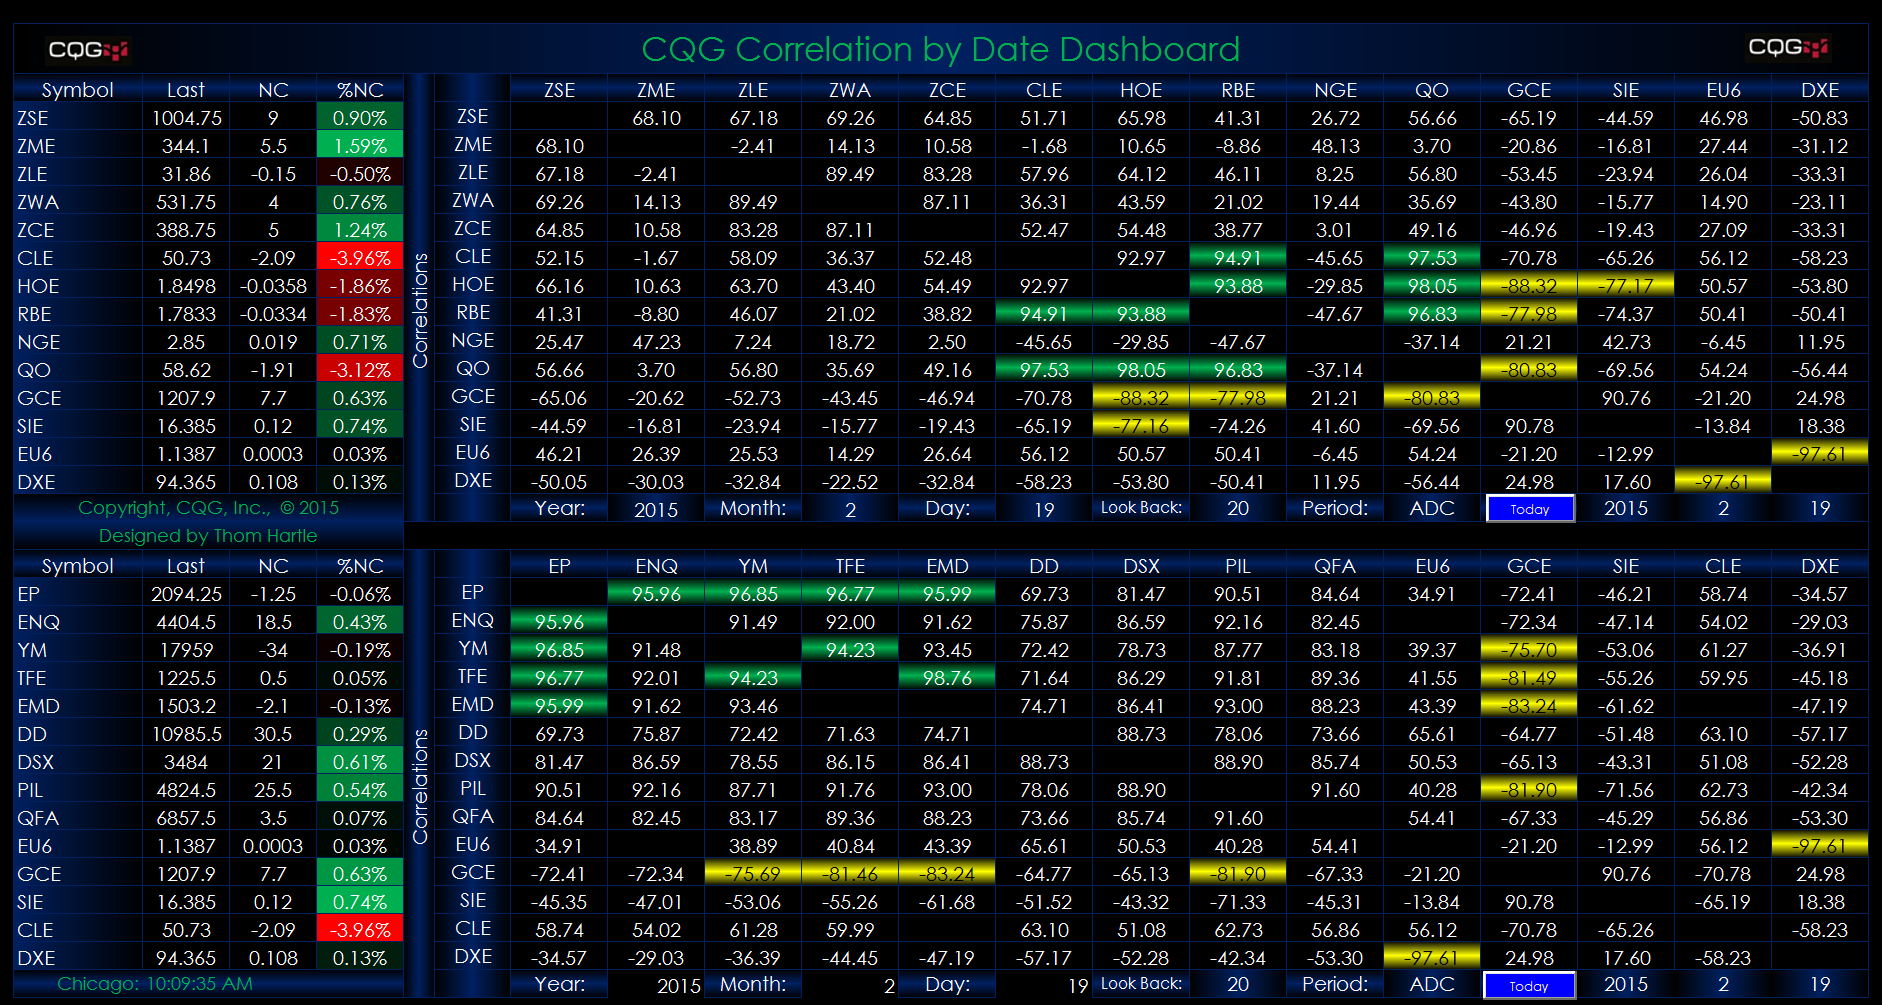
The correlation matrices use the same symbols entered into the first column of the two displays. Each display allows you to enter in a date (year, month, and day) at the bottom, and then the correlations on that date are displayed. The top ten correlated markets are highlighted in green and the bottom ten correlated markets are highlighted in yellow. Blank cells appear if the date is a weekend or a holiday.
To use today's date, click the "Today" toolbar button and today's date is automatically entered into the date cells.
Please note, you may need to enable macros for full spreadsheet functionality. Otherwise, manually enter today's date.
Requires CQG Integrated Client or CQG QTrader (QTrader standard package is limited to three years of historical data), data enablements for all symbols used in this spreadsheet, and Excel 2010 or more recent.