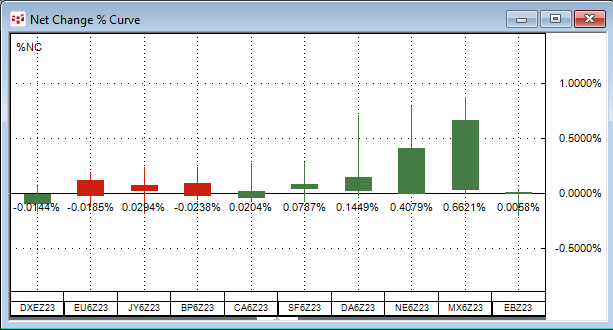
The Net Change Curve chart displays a collection of symbols’ daily net price change or daily net percentage change making it easy to compare on a relative basis each market’s current session’s… more
Workspaces
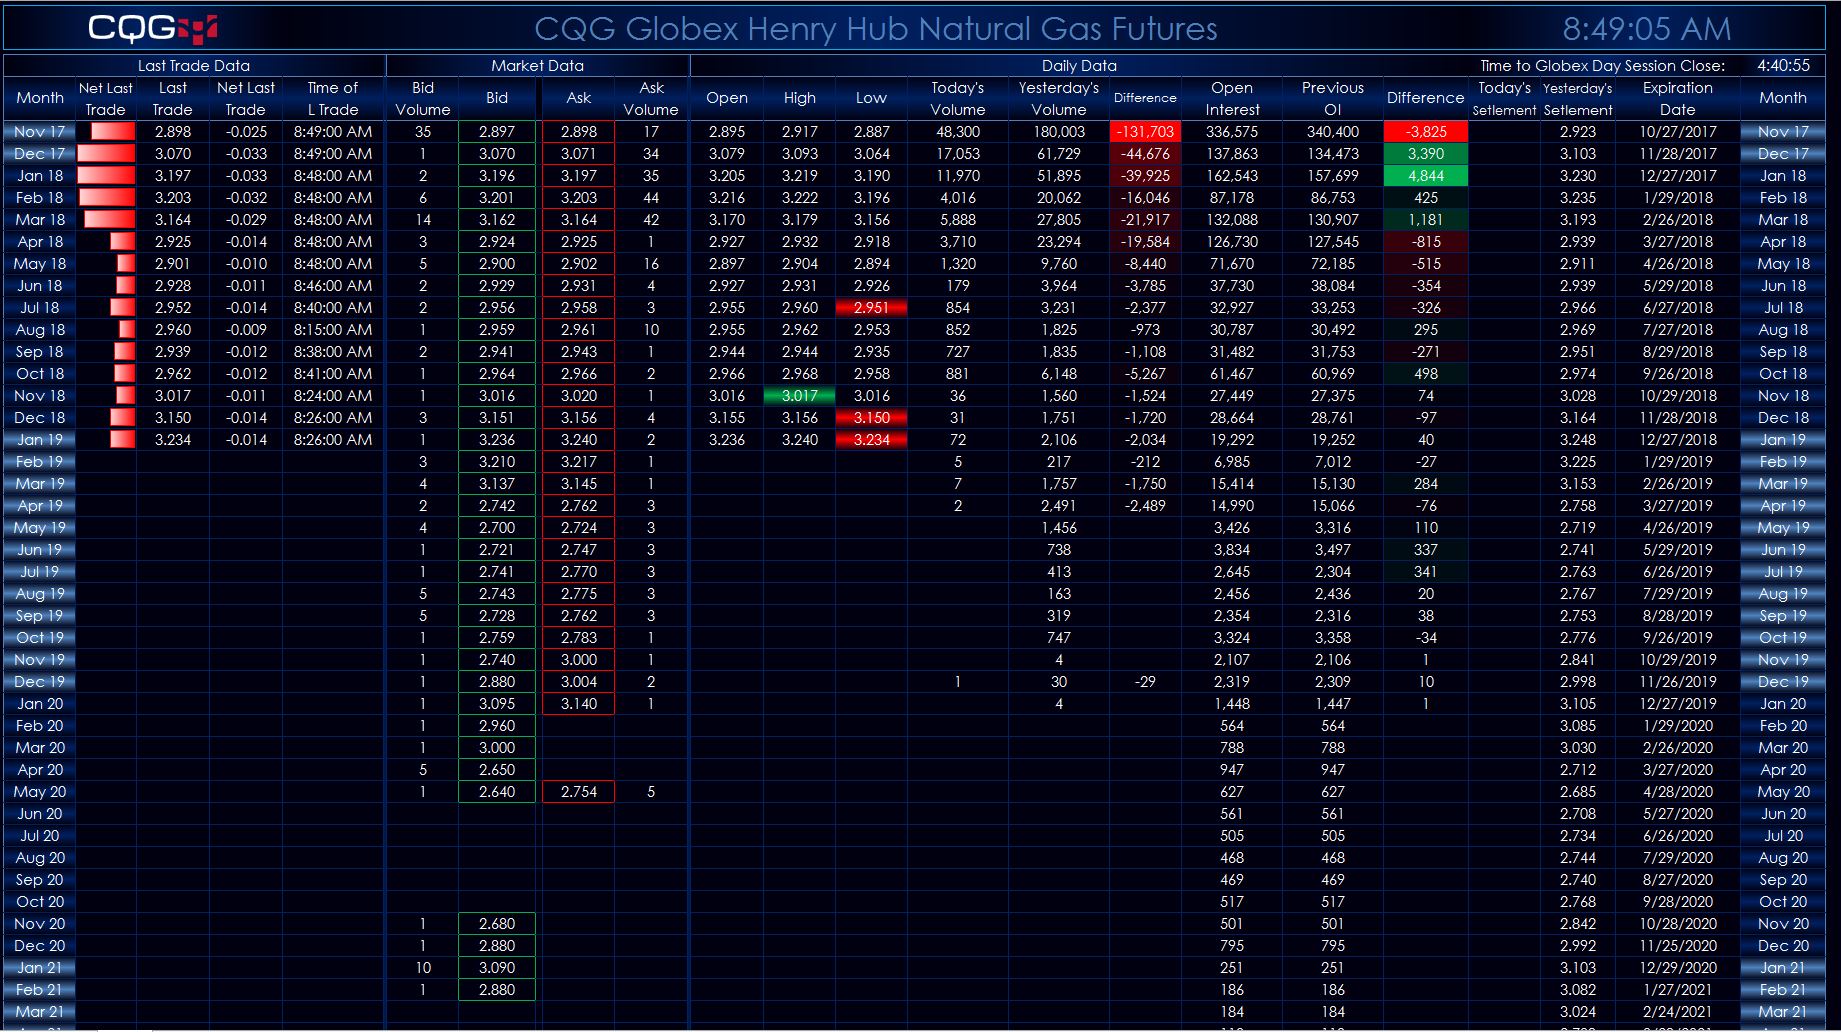
This Microsoft Excel® dashboard has three tabs. The first tab displays today’s market quotes, volume, and open interest data. If the last price is matching the open price, then the open price… more
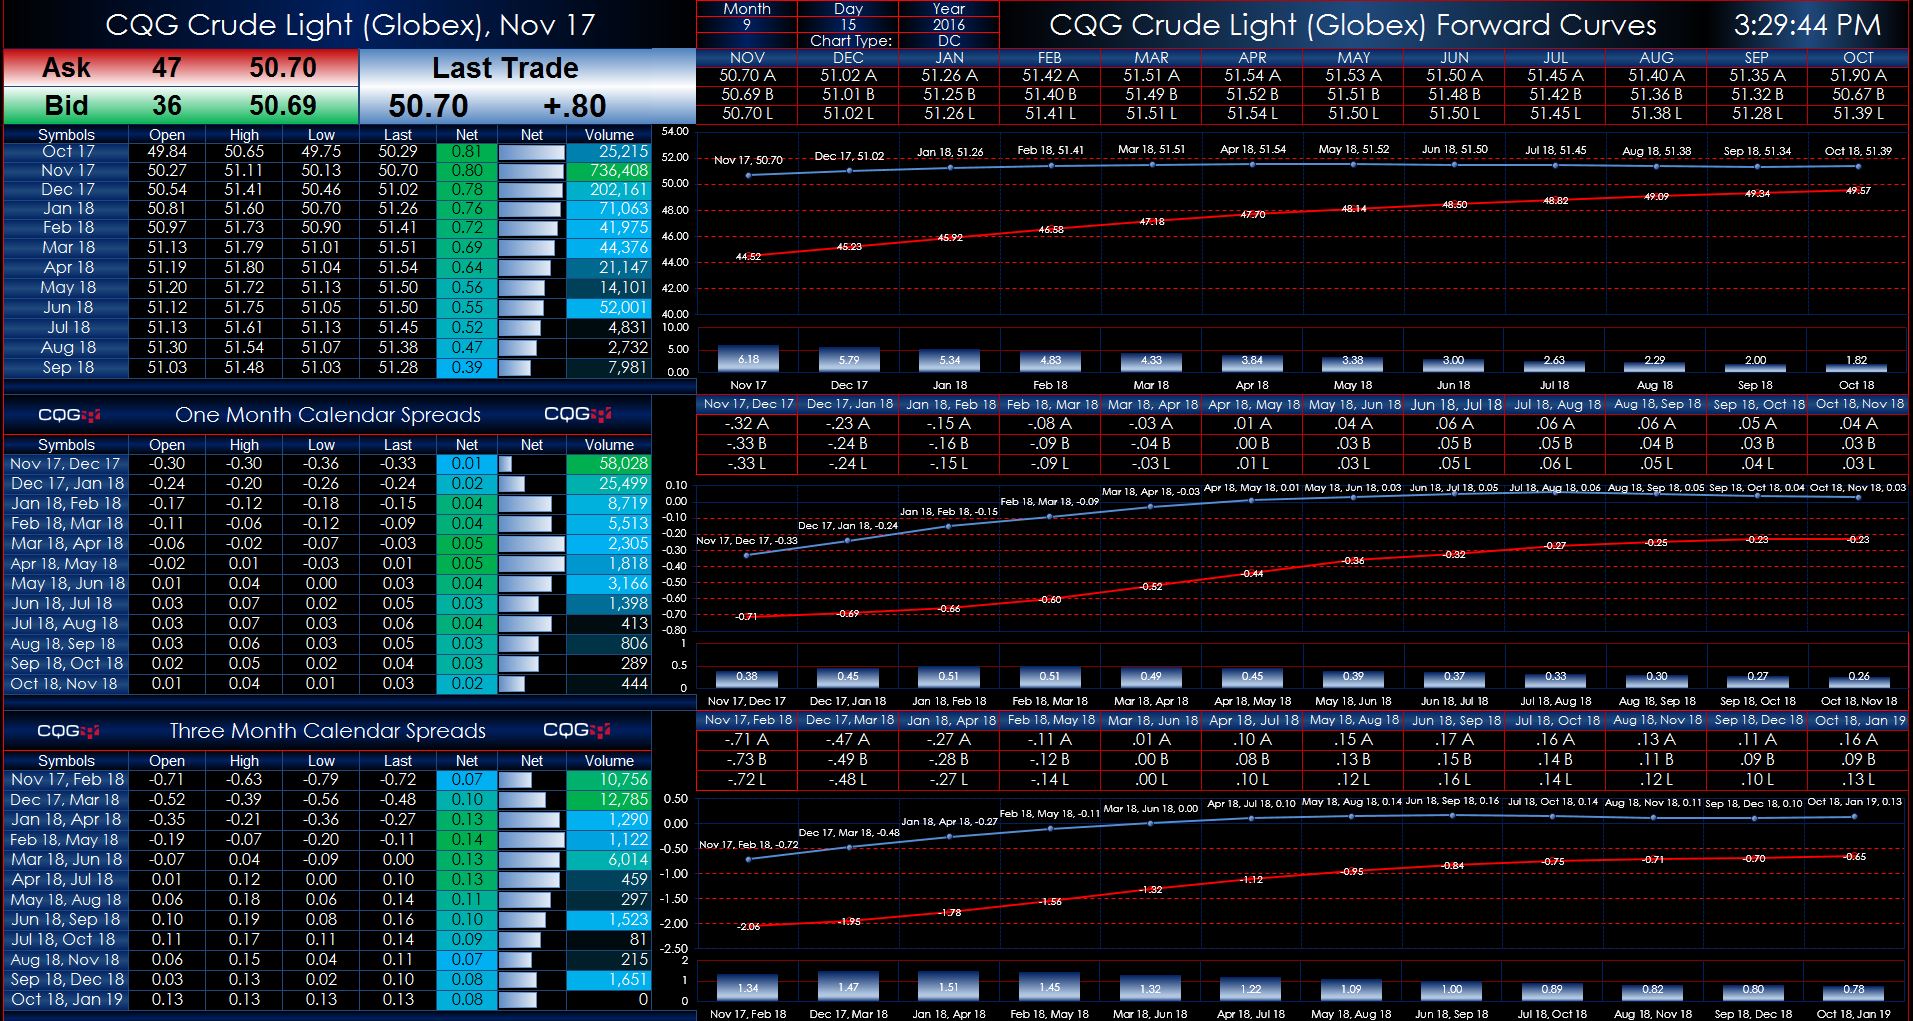
These two Microsoft Excel® spreadsheets present Globex crude oil market data and forward curves, both current and historical. Two dashboards are available: The first the data includes outrights… more