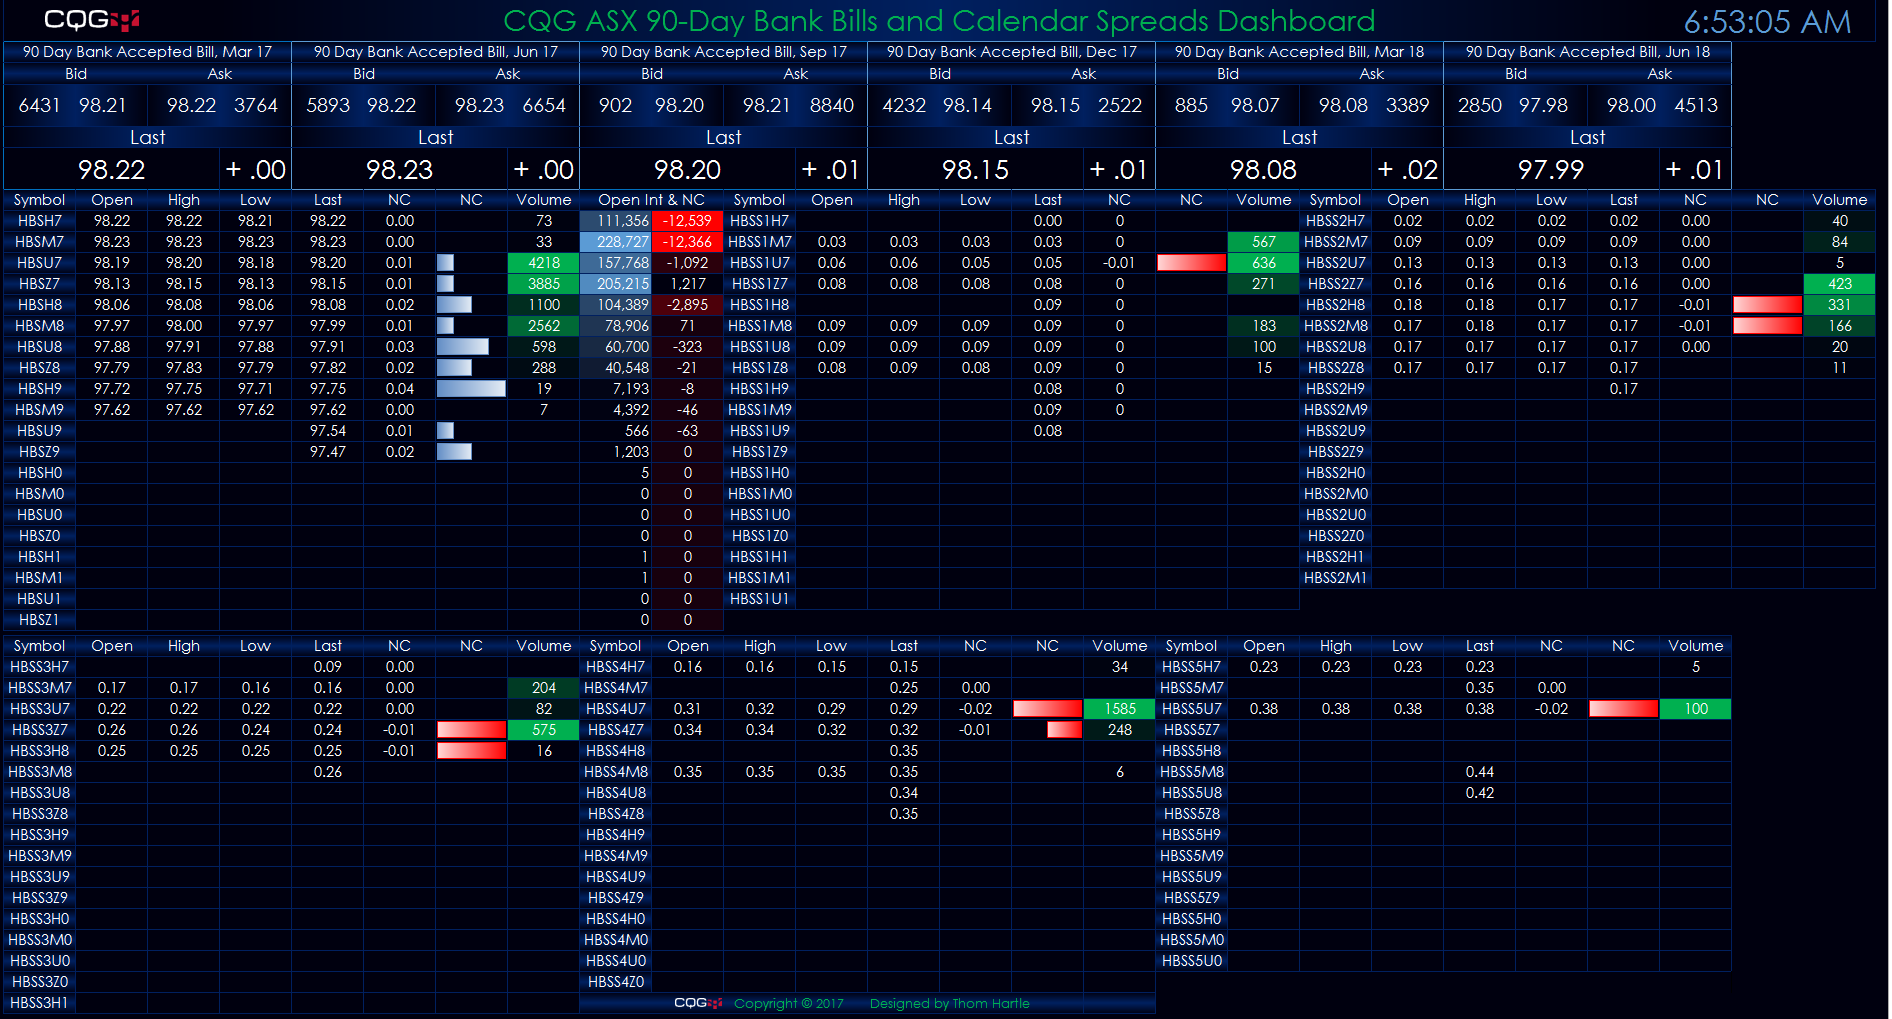
This Microsoft Excel® dashboard displays 90-day bank bills and exchange-traded spreads traded on ASX. The inside market for the front six contracts is detailed along the top. The open, high, low,… more
Workspaces
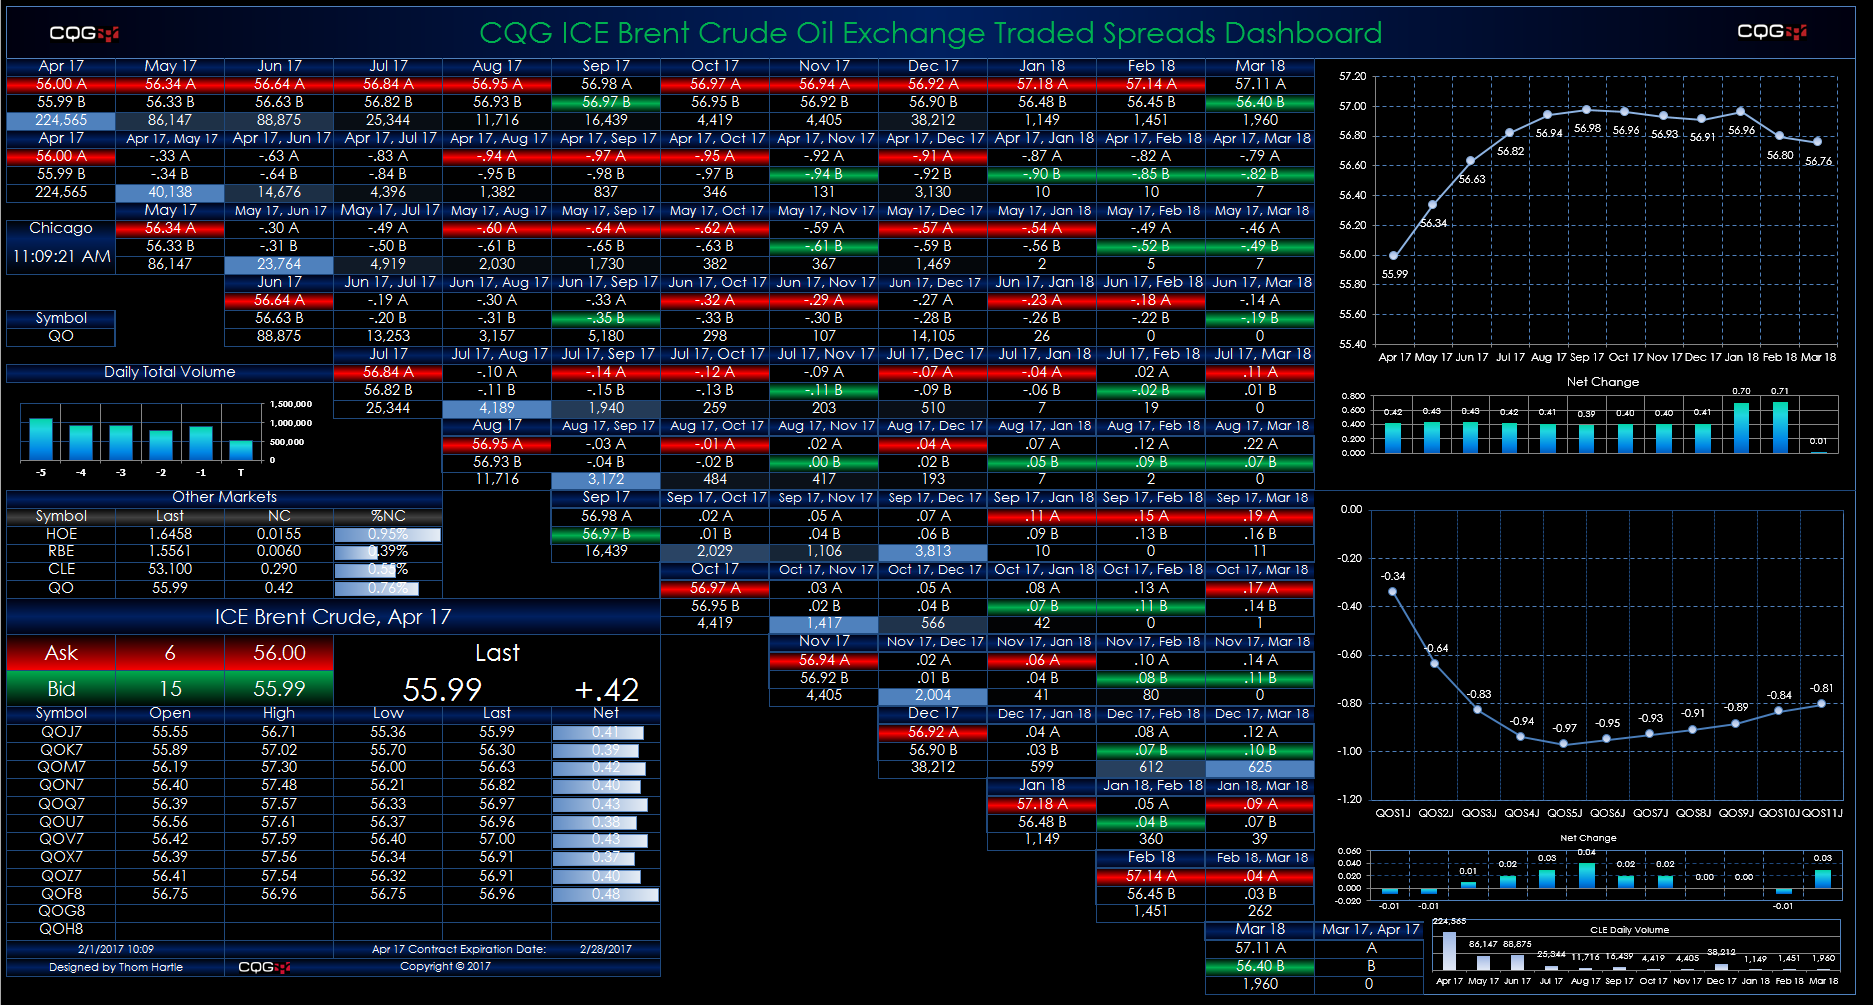
This Microsoft Excel® dashboard displays market data for crude oil spreads traded on the ICE platform using a matrix-style format. The outrights are along the top row and the start of each… more
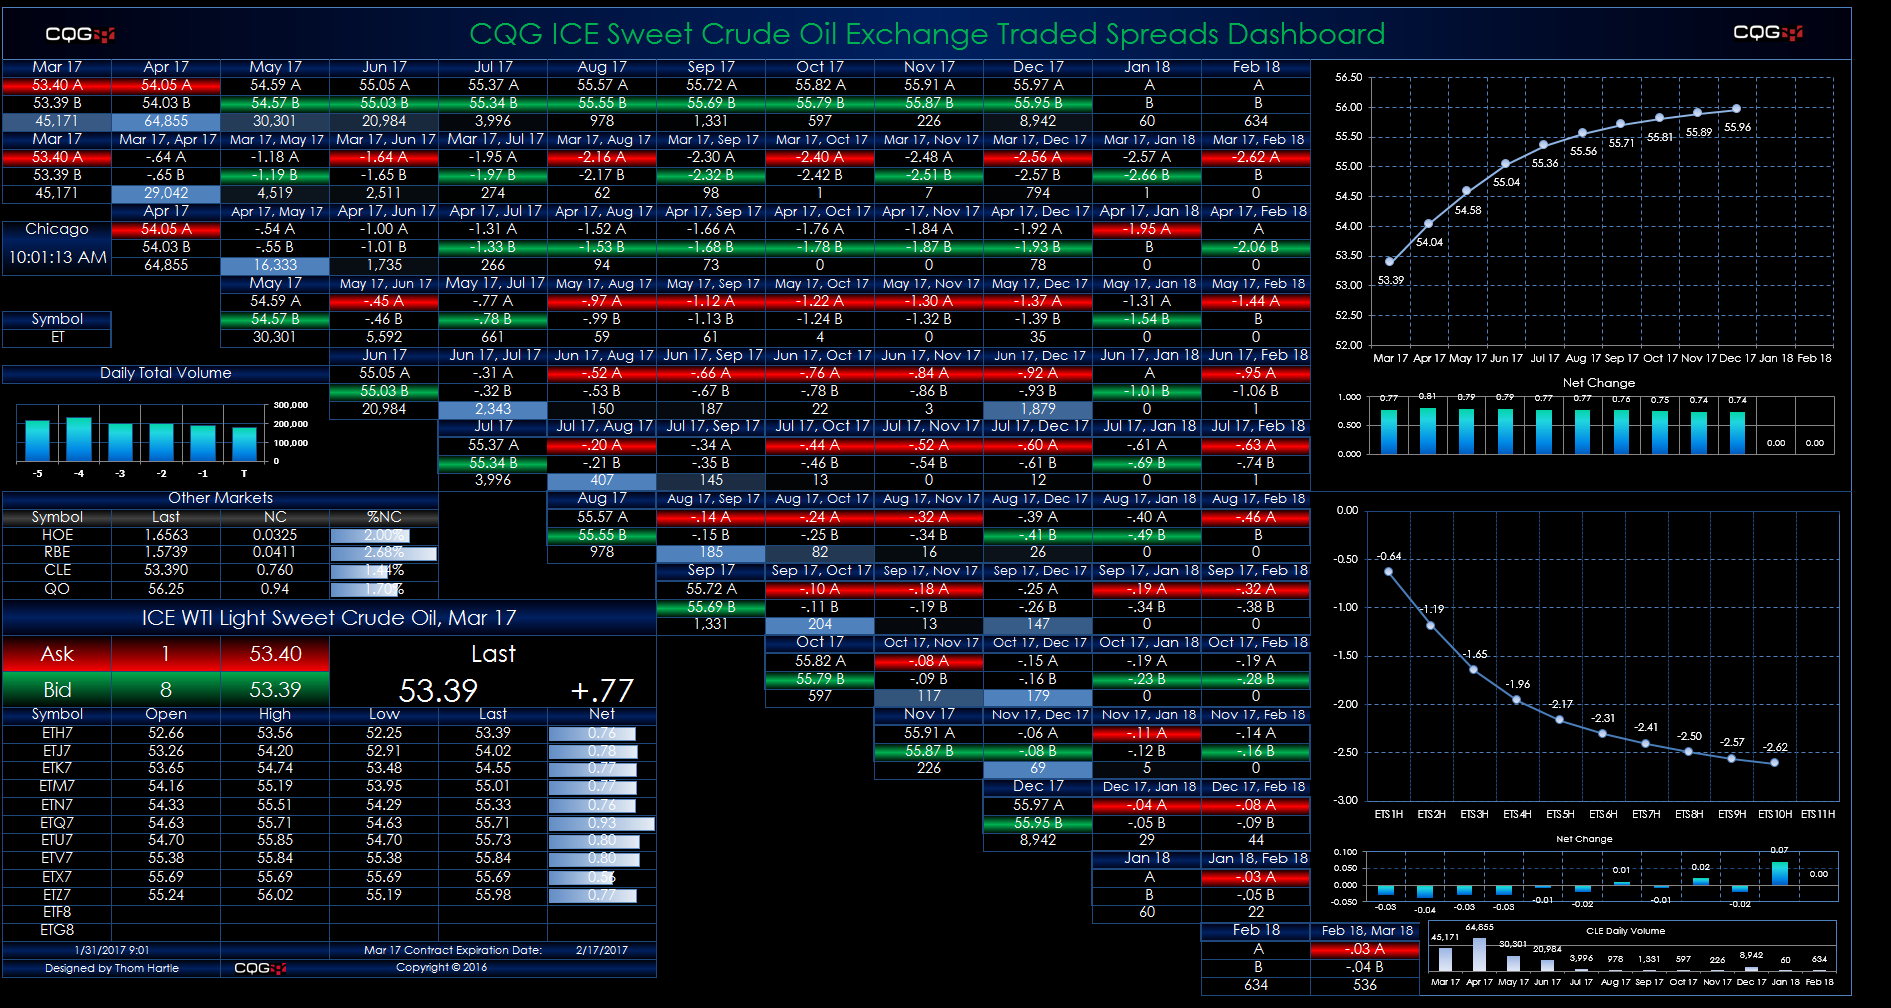
This Microsoft Excel® dashboard displays market data for crude oil spreads traded on the ICE platform using a matrix-style format. The outrights are along the top row and the start of each… more
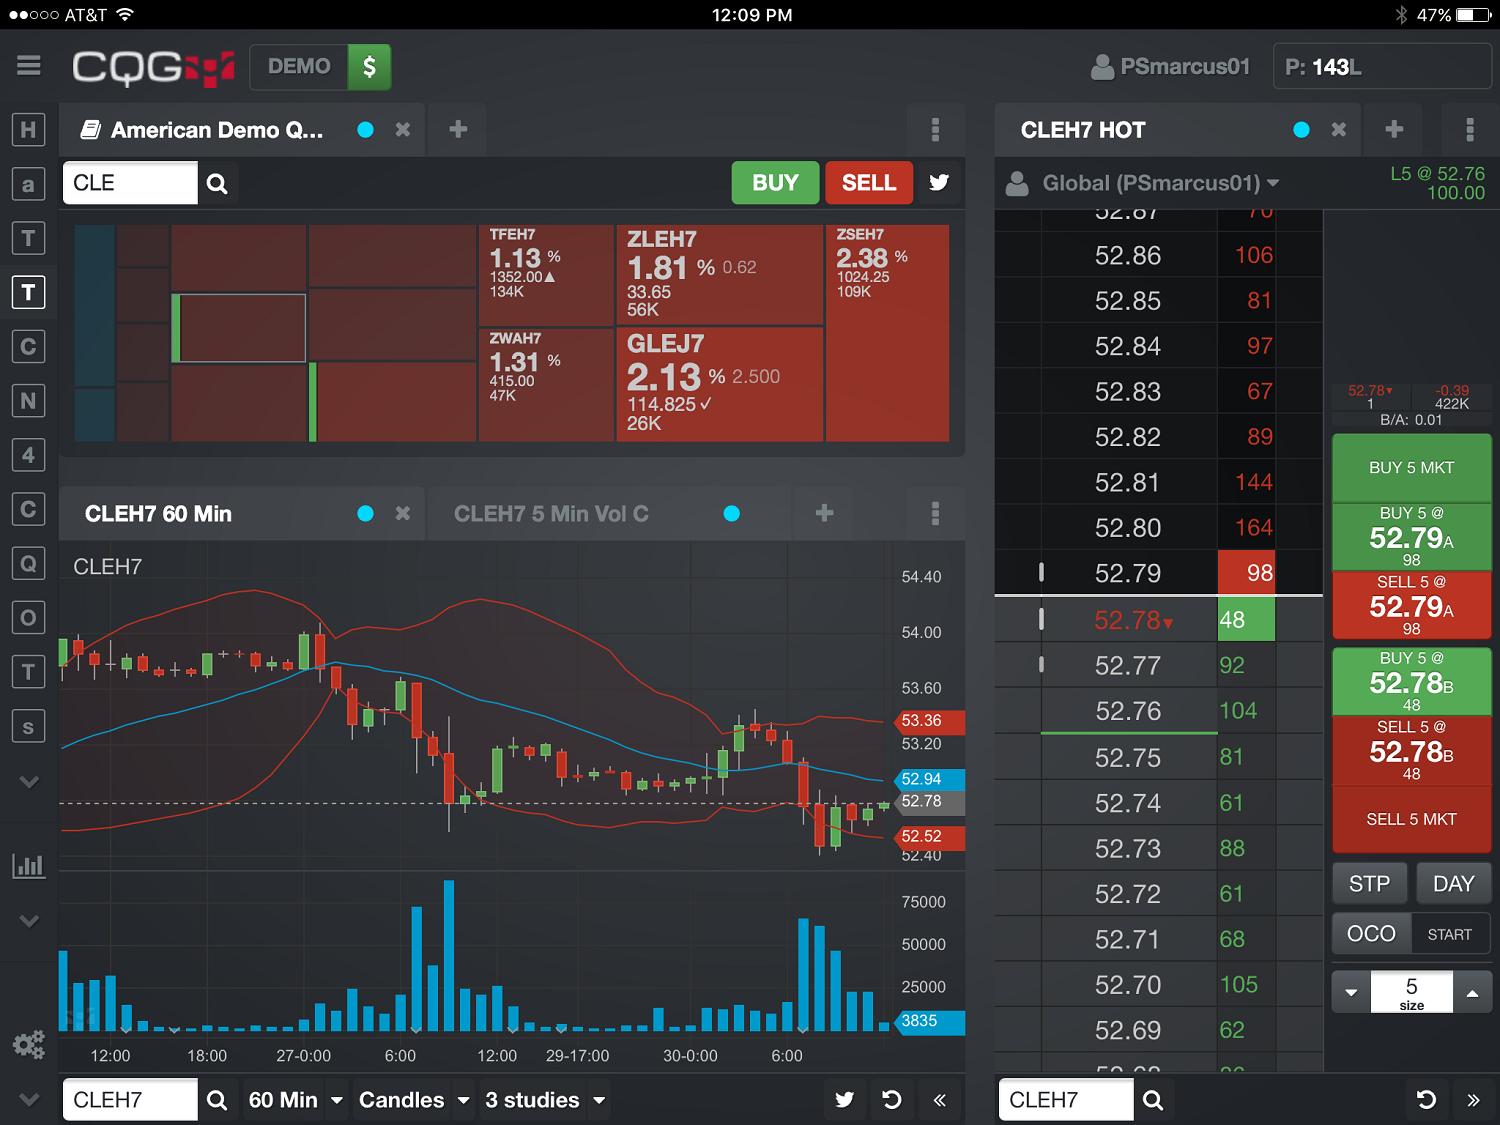
This CQG M dashboard layout displays a portfolio of symbols from the Americas (available with a subscription to the CME Globex feed on CQG) in a heat-map style. Tapping on a quote pushes the… more
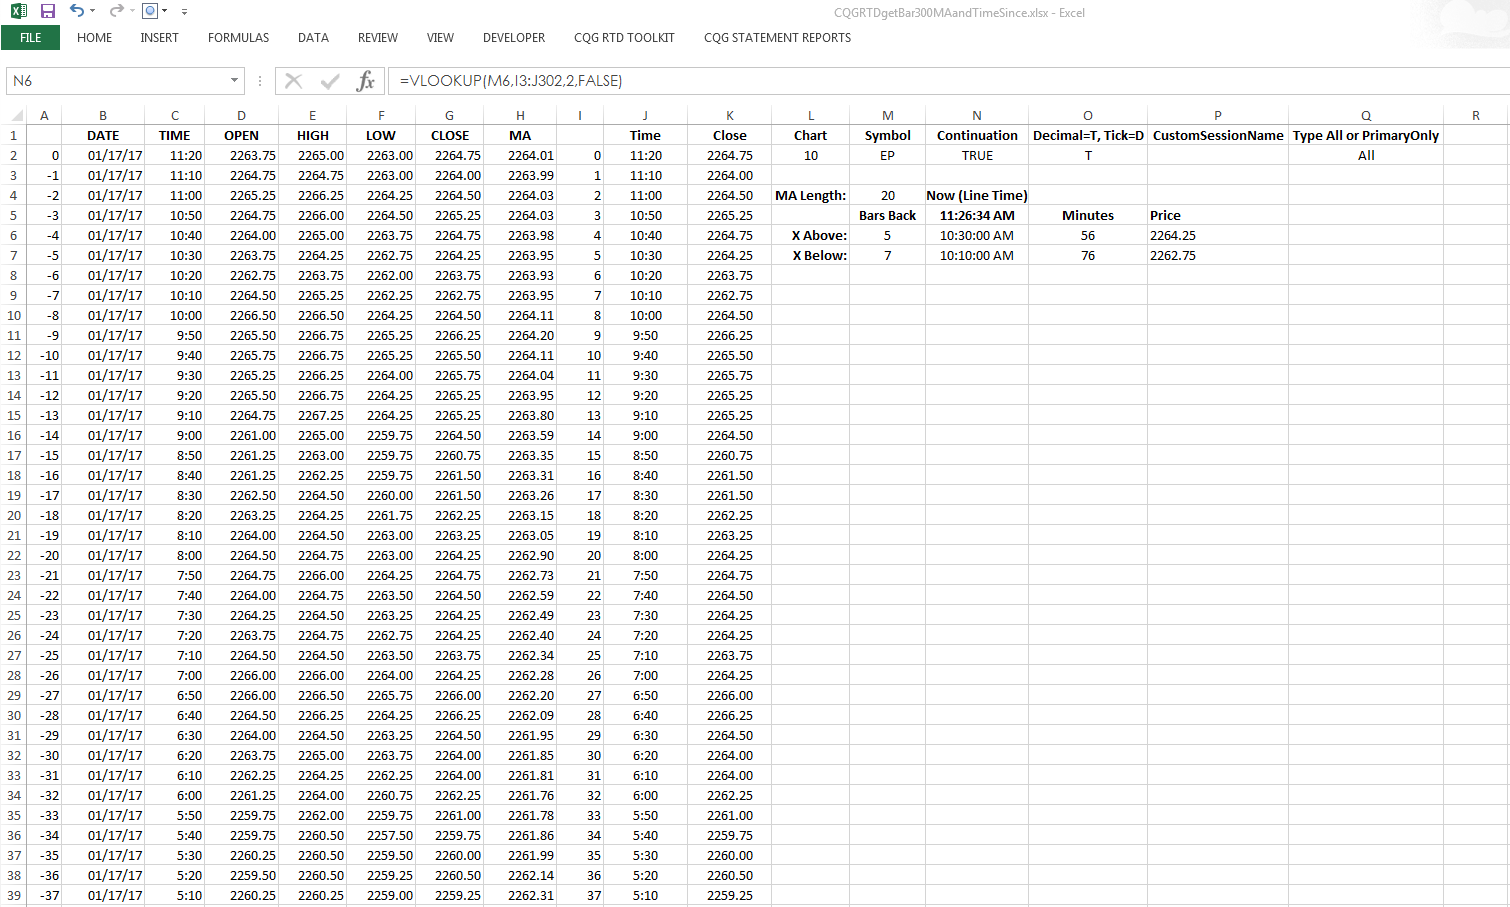
CQG formulas include a crossover feature, and CQG can determine the number of completed bars back since a signal occurred. For example, using “Barssince(EP xabove Ma(EP,Sim,20),1,300)” as the… more
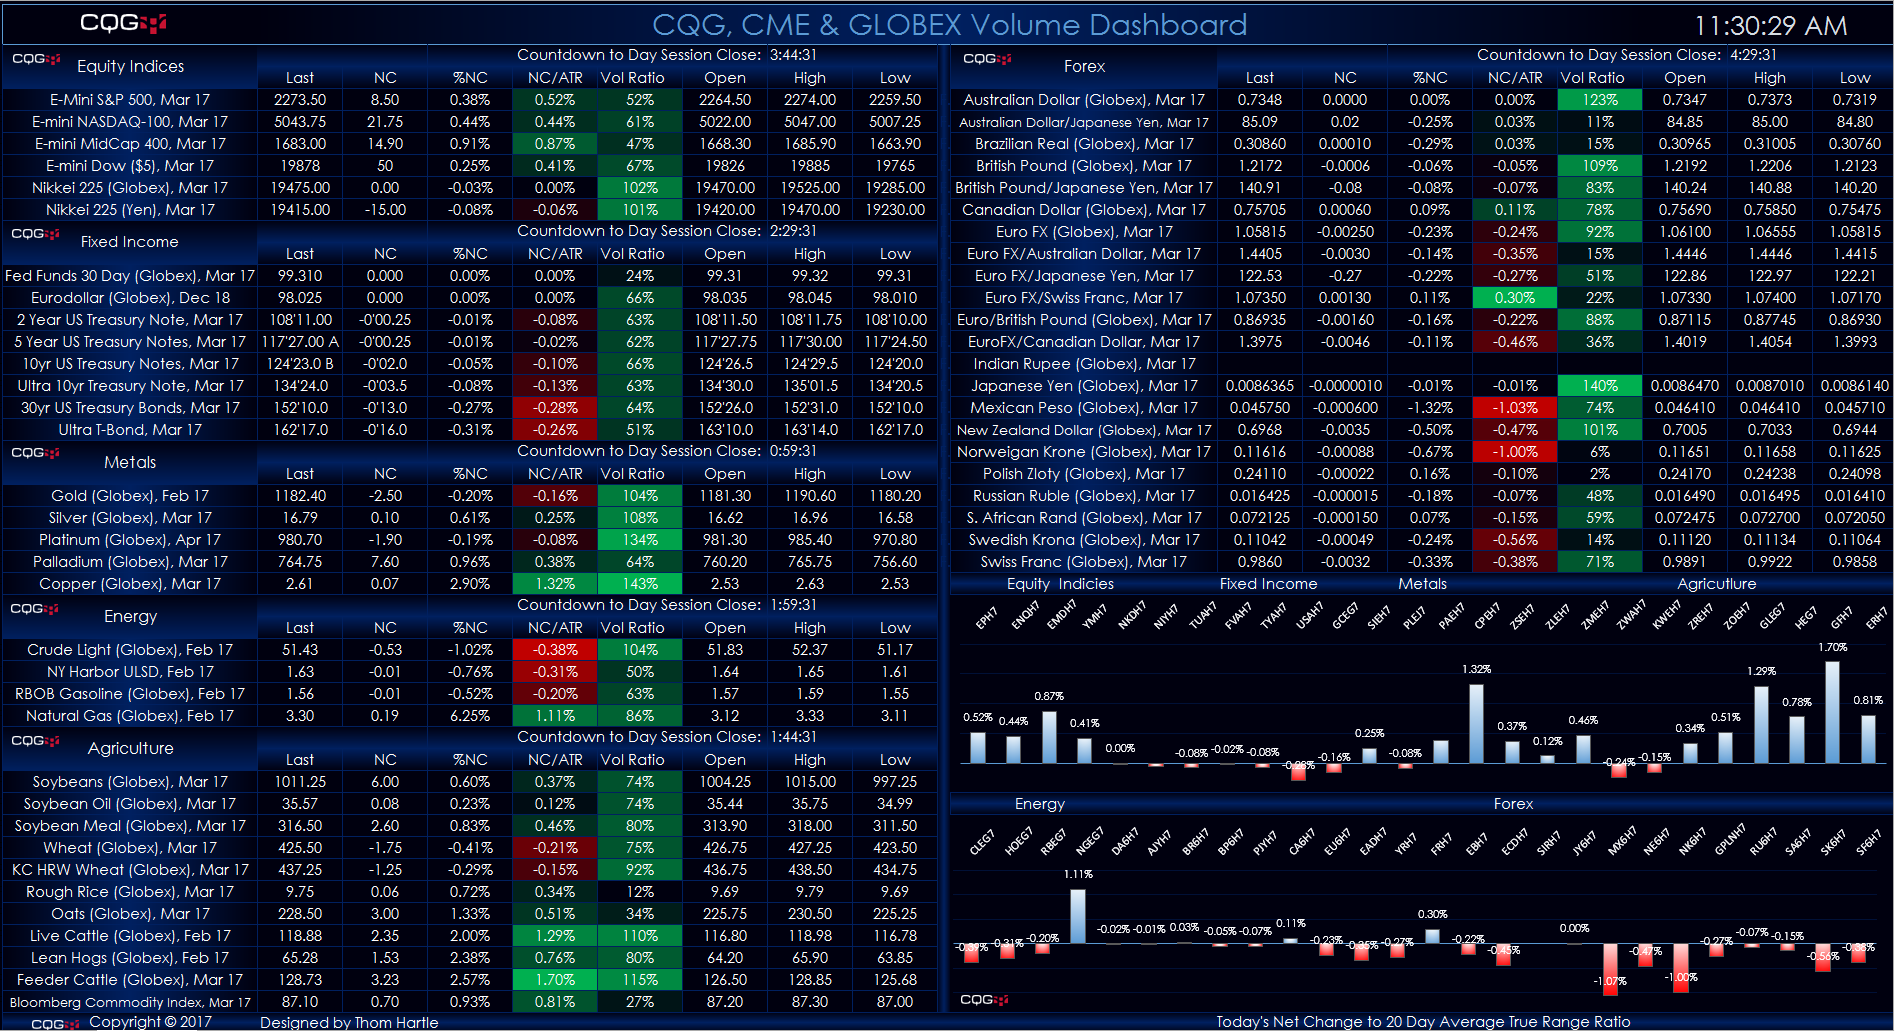
This Microsoft Excel® dashboard displays key market information for contracts traded on the CME Exchange and the Globex platform. The markets are grouped by these products:
Equity Indices… more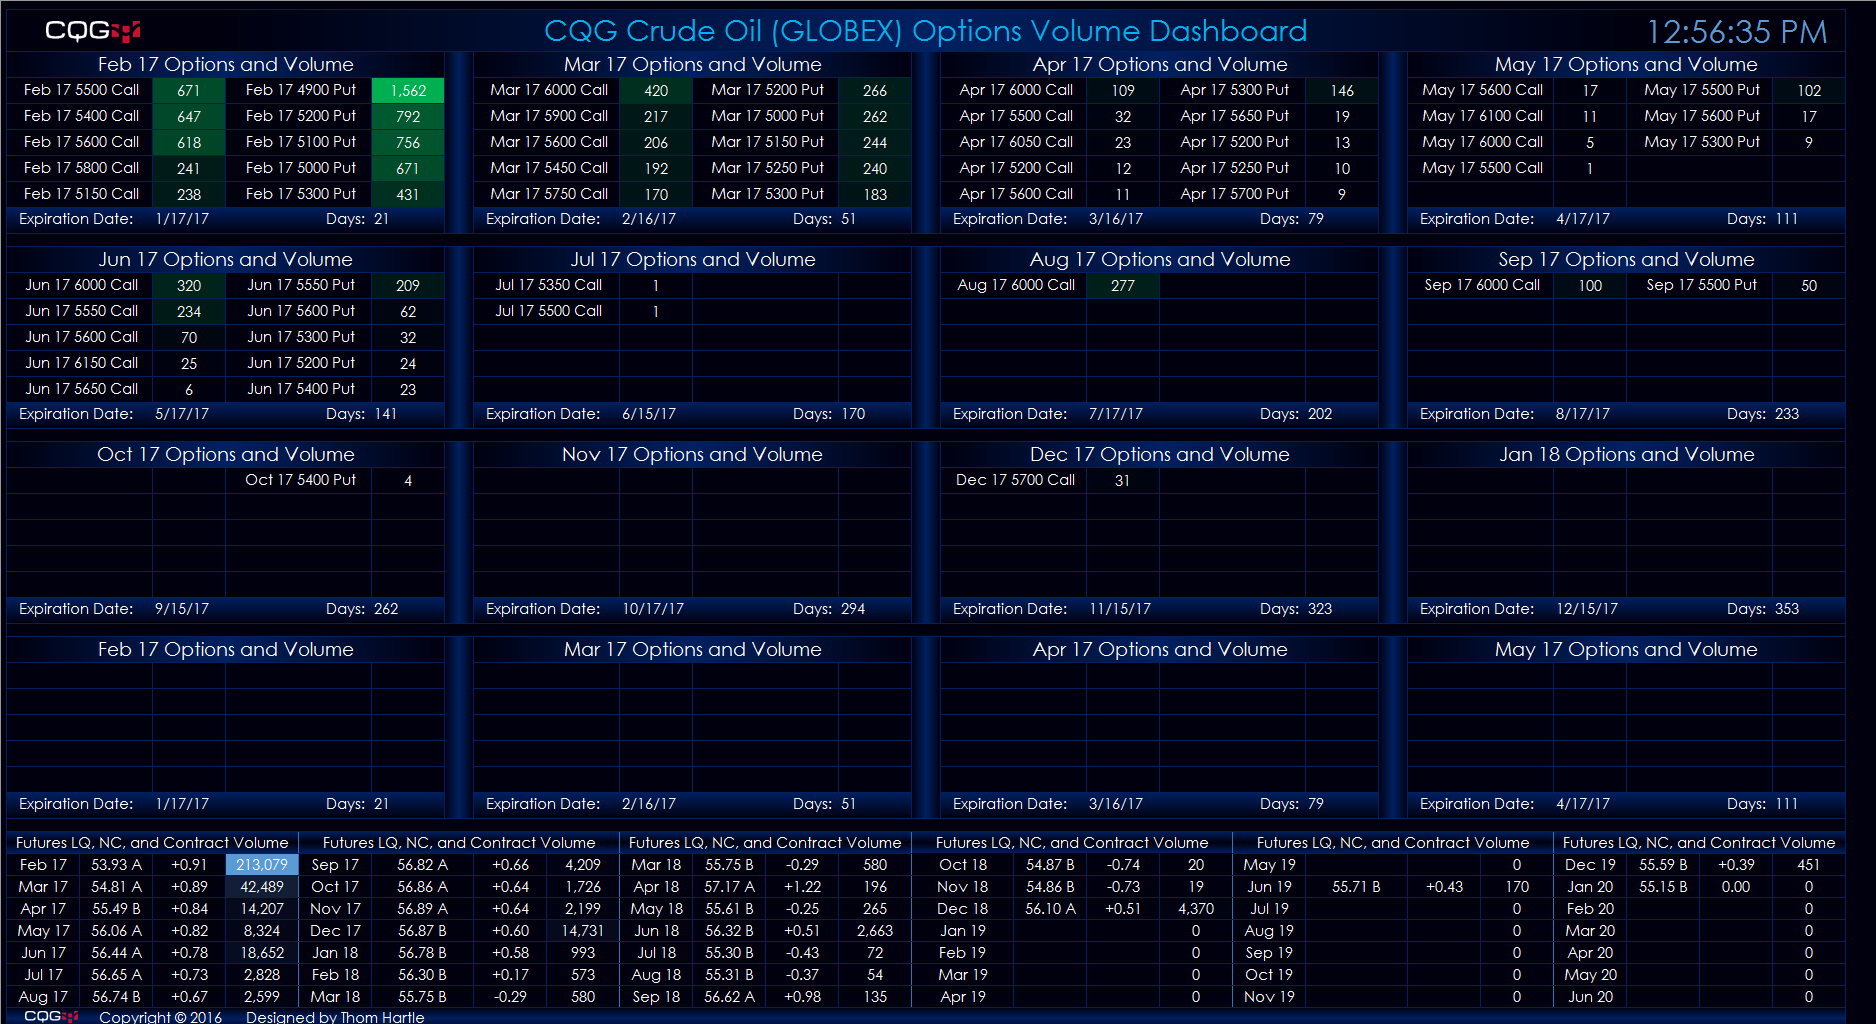
This Microsoft Excel® dashboard scans the crude oil (GLOBEX) futures market options for volume and ranks the traded volume for each expiry out to sixteen months. The scan covers options… more
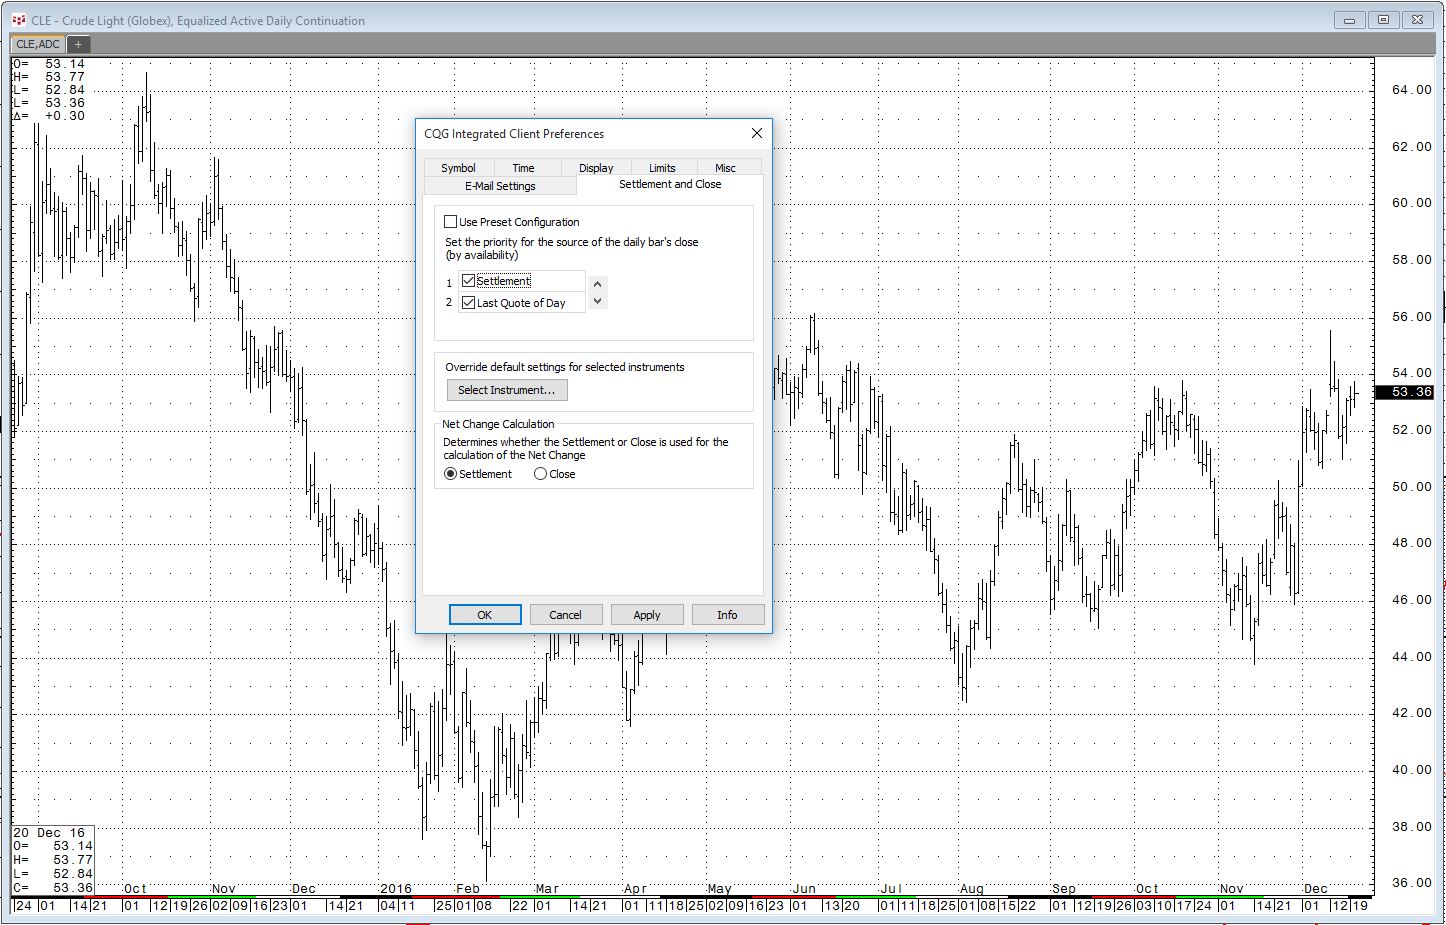
A common request is an RTD formula to pull historical settlement prices for a particular market. There is a “Contract Data” RTD formula for settlement:
=RTD("CQG.RTD", ,"ContractData", "CLE… more
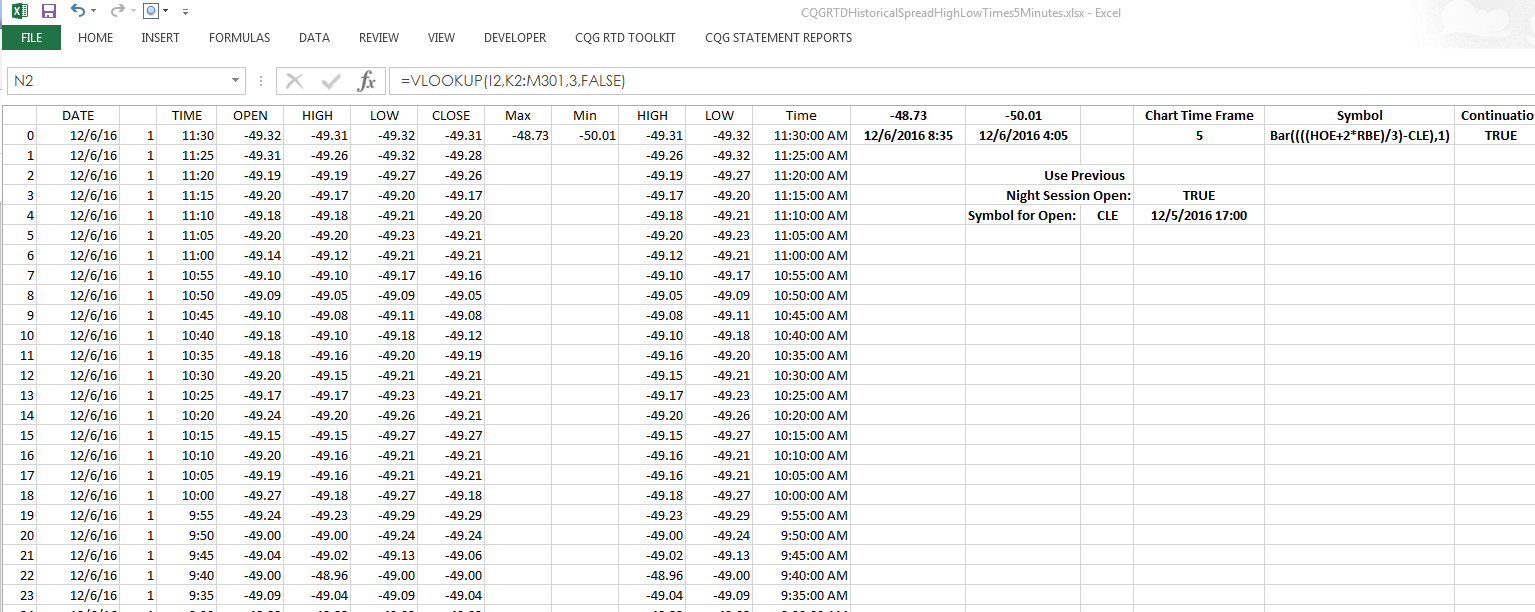
CQG Integrated Client and CQG QTrader customers can pull the time the high and low occurred during today’s session into a Microsoft Excel® spreadsheet using these RTD formulas:… more
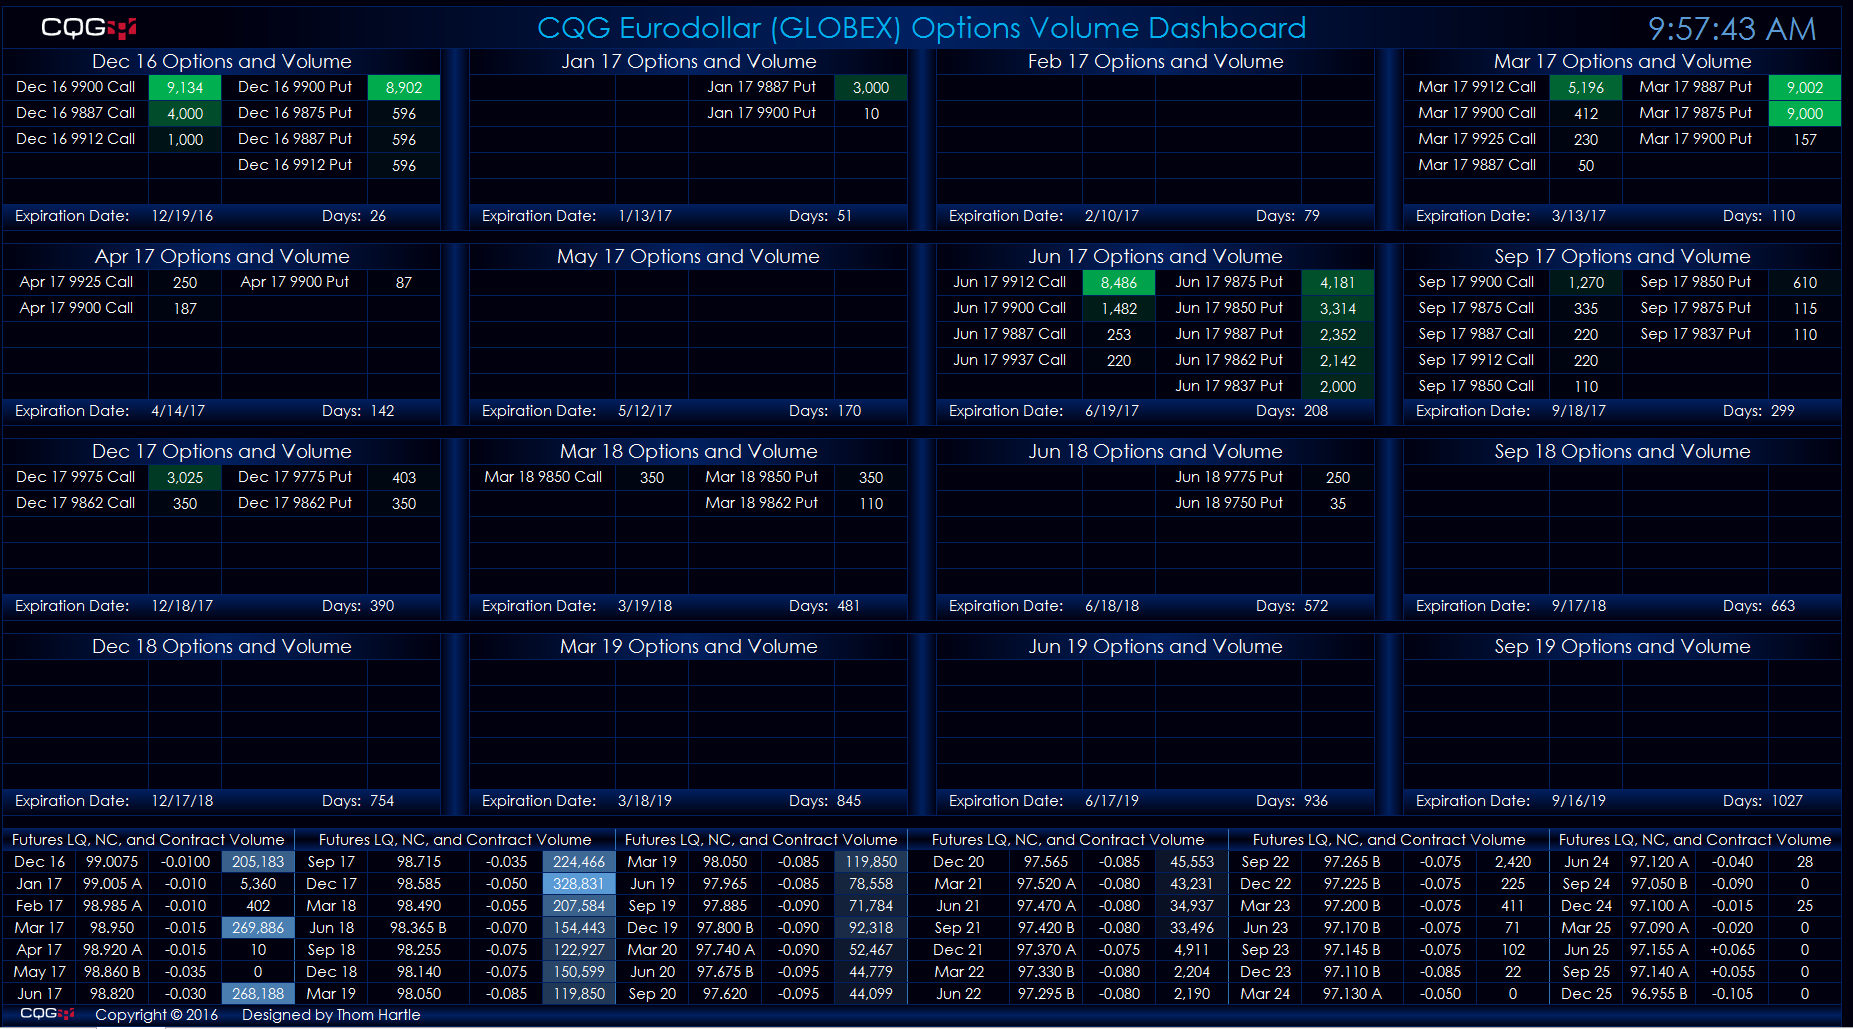
This Microsoft Excel® dashboard scans the options on the Eurodollar futures market for volume and ranks the traded volume for each expiry out to three years. The scan covers options traded ten… more