This post, which includes a downloadable Excel sample at the bottom of the post, describes how to use Excel's XMATCH function to search a large table. The table used consists of the constituents of the NASDAQ 100 Index with a set of performance measurements, i.e., Weekly percent net change, Monthly percent net change, and Annual percent net change.
Then using the XMATCH function the top ten performers are displayed in a table.
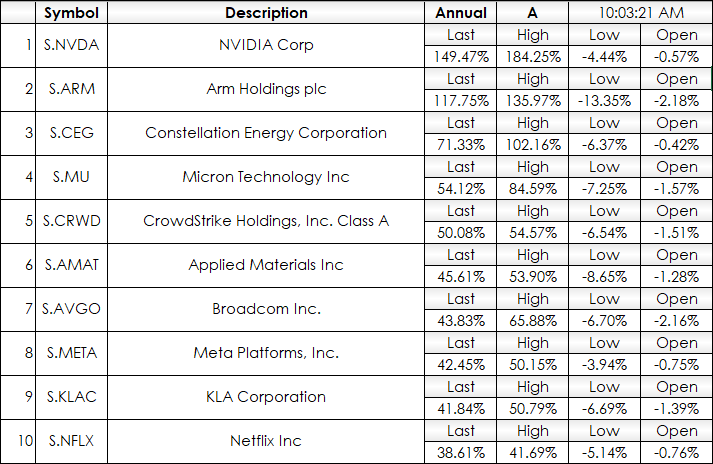
The table above is drawn from the main table where the stocks in the NASDAQ 100 are listed in alphabetical order.
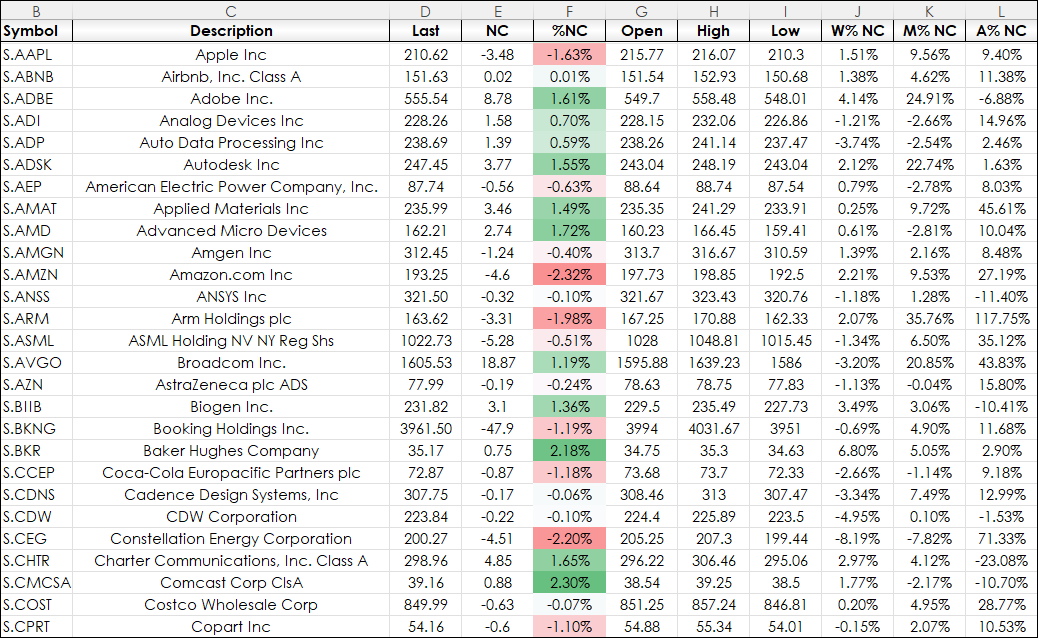
All RTD and Excel functions are entered in the first row and copied down to row 103.
The Weekly % Net Change (W% NC) column uses the percent bar RTD formula set to 1 week's change. The formulas are copied down to row 103.
=IFERROR(RTD("cqg.rtd",,"StudyData",B2, "PCB","BaseType=Index,Index=1", "Close", "W",,"all",,,,"T")/100,"")The Monthly % Net Change (M% NC) column uses the percent bar RTD formula set to 1 month's change. The formulas are copied down to row 103.
=IFERROR(RTD("cqg.rtd",,"StudyData",B2, "PCB","BaseType=Index,Index=1", "Close", "M",,"all",,,,"T")/100,"")The Annual % Net Change (A% NC) column uses the percent bar RTD formula set to 1 year's change. The formulas are copied down to row 103.
=IFERROR(RTD("cqg.rtd",,"StudyData",B2, "PCB","BaseType=Index,Index=1", "Close", "A",,"all",,,,"T")/100,"")The next steps towards creating the top ten table are to determine the top ten percent net change for the column, then the location (the row number) within the column and use that location to determine the symbol.
To find the top ten values in each column of the percent net change. Excel 365 offers the LARGE function. The function requires an array to search and the k value where k = 1,2,3...
For the weekly data the array is column J. The LARGE function has two parameters: an array to search and the rank, i.e., first (1) is in cell M2, second (2) is in cell M3, etc. For the top value in the Weekly % Net Change the function used is:
=LARGE(J2:J103,M2)
With that value returned the XMATCH function is used. The XMATCH function will find the "Large" value and return the row number of the cell.
XMATCH(LARGE(J2:J103,M2),J2:J103)+1)
The array starts at cell J2, so the "+1" is added to return the correct cell row number with the "LARGE" value. The correct row number is combined with the column letter, which for the symbol is column B.
The INDIRECT function will return the symbol based on the cell's address. For example, if the XMATCH determines the LARGE function is in cell row number 74 then "B" is combined with 74 to return B74 and the INDIRECT function returns the symbol in cell B74.
INDIRECT("B"&XMATCH(LARGE(J2:J103,M2),J2:J103)+1)Finally, the tables are looking for Weekly % Net Change, Monthly % Net Change, and Annual % Net Change.
This is selected in the dropdown list in cell P1.
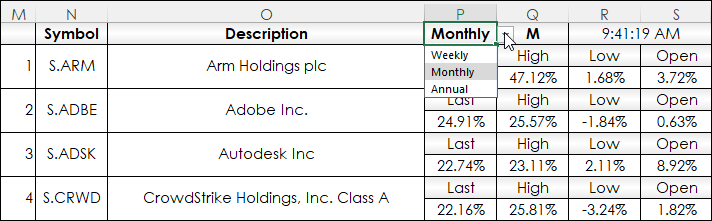
The final Excel formula checks for Weekly, Monthly, or Annual from the value in cell Q1.
=IFERROR(IFS(Q1="W",INDIRECT("B"&XMATCH(LARGE(J2:J103,M2),J2:J103)+1),Q1="M",INDIRECT("B"&XMATCH(LARGE(K2:K103,M2),K2:K103)+1),Q1="A",INDIRECT("B"&XMATCH(LARGE(L2:L103,M2),L2:L103)+1)),"")This process is repeated for the description except the column (B) used for the INDIRECT function is replaced with "C" column.
Kowing the symbol (cell N2) then the RTD call CQG's Percent Change bar chart is used to return Last, High, Low, Open.
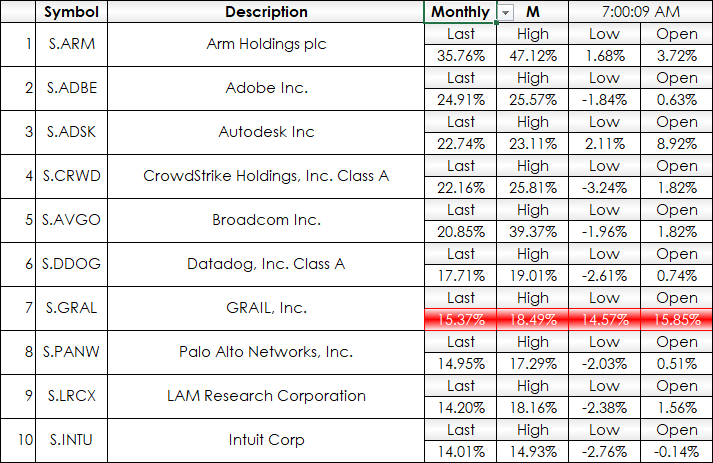
=IFERROR(RTD("cqg.rtd",,"StudyData",N2, "PCB","BaseType=Index,Index=1", "Close",$Q$1,,"all",,,,"T")/100,"")=IFERROR(RTD("cqg.rtd",,"StudyData",N2, "PCB","BaseType=Index,Index=1", "High",$Q$1,,"all",,,,"T")/100,"")=IFERROR(RTD("cqg.rtd",,"StudyData",N2, "PCB","BaseType=Index,Index=1", "Low",$Q$1,,"all",,,,"T")/100,"")=IFERROR(RTD("cqg.rtd",,"StudyData",N2, "PCB","BaseType=Index,Index=1", "Open",$Q$1,,"all",,,,"T")/100,"")One issue is if a new stock is added to the NASDAQ 100 then the LARGE function may return incorrect values due to a new issue may not having historical values.
For example, during the last week of June 2024 Grail, Inc (Symbol: S.GRAL) was divested from Illumina. Consequently, the stock does not have any trades from the previous week, etc. , That being the case then CQG's Percent Change Bar chart will not have a value and returns a blank cell. If that is the case then the row is highlighted in Red to indicate the issue.
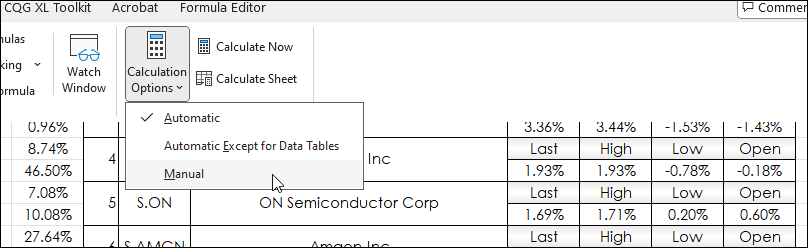
Finaly, the spreadsheet is calling for over 1,100 RTD calls and during high market activity, such as an economic release, can create a heavy load for the CPU. It is recommended that just prior to an economic release the spreadsheet is switched to manual from automatic. Go to Formulas/Calculation Options. The clock will stop updating. This manual setting will affect all open spreadsheets.
Requirements: CQG Integrated Client or QTrader, and Excel 365 (locally installed, not in the Cloud) or more recent.