CQG formulas include a crossover feature, and CQG can determine the number of completed bars back since a signal occurred. For example, using “Barssince(EP xabove Ma(EP,Sim,20),1,300)” as the symbol in a standard RTD formula for the close will return the number of bars since the last price closed above a 20-period simple moving average using 10-minute bars:
= RTD("cqg.rtd",,"StudyData","Barssince(EP xabove Ma(EP,Sim,20),1,300)", "Bar",, "Close", "10",,"All",,,,"T")
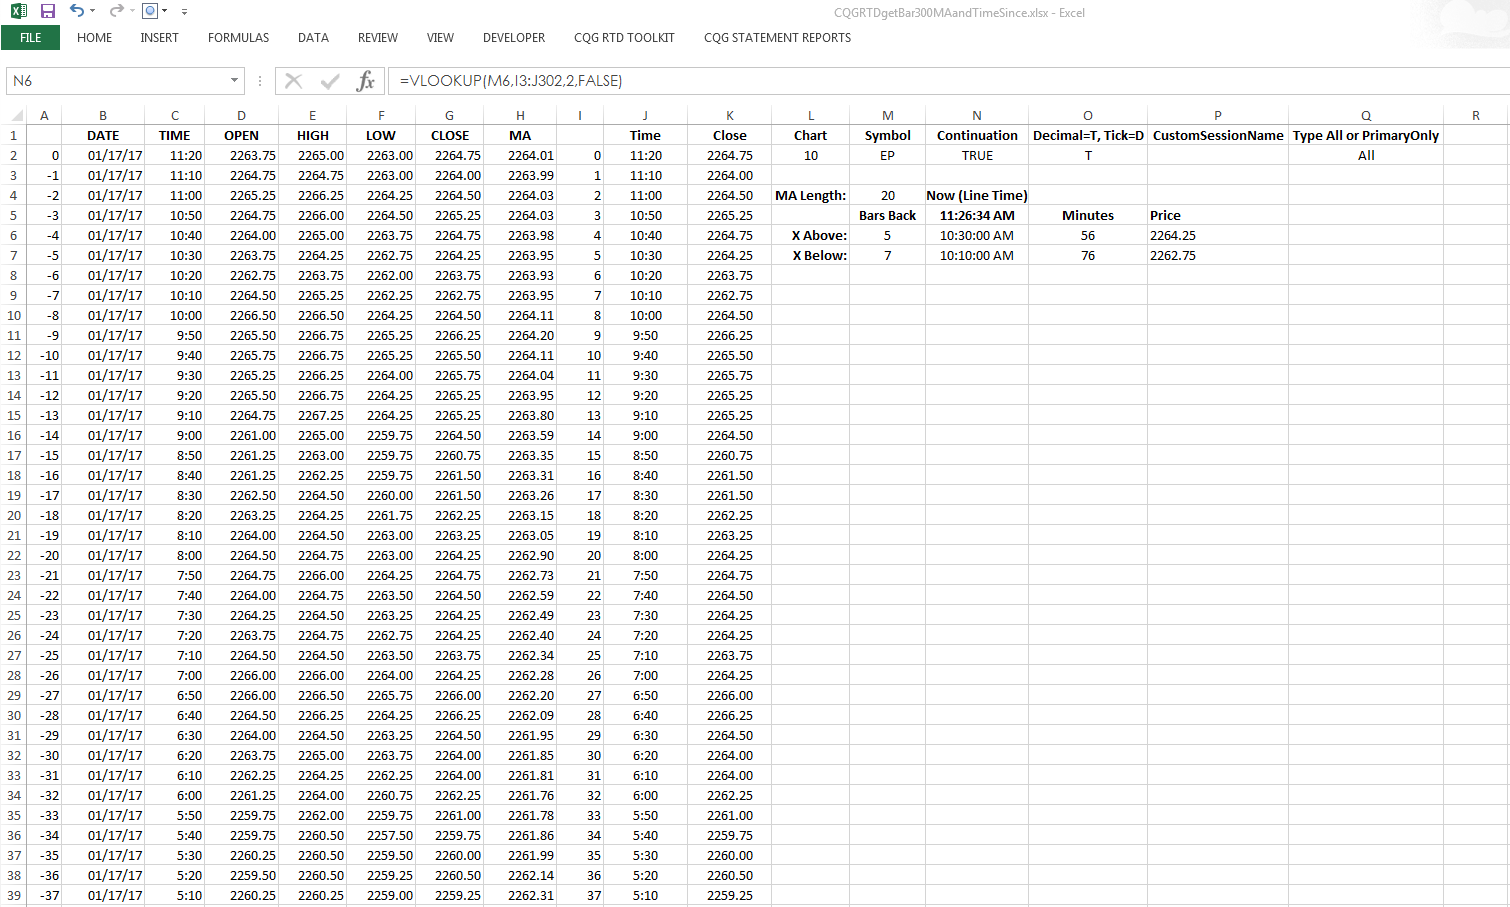
The downloadable sample Microsoft Excel® spreadsheet uses the RTD formulas for xabove and xbelow in cells M6 and M7 to retrieve the bars since the last event occurred. Columns I, J, and K list the bar count, the time, and the closing prices. Then in cells N6 and N7, the Excel VLookup function is used to pull in the time. In cells P6 and P7, the Excel VLookup function is used to pull in the closing prices. For more details about using Excel's VLookup function, consult Excel Help.
Learn more
Requires CQG Integrated Client or CQG QTrader, data enablements for all symbols used in the spreadsheet, and Excel 2010 or higher.