Optimism ran high at the start of 2020. The United States and China were about to sign the “phase one” trade deal that de-escalated the trade war that hung over markets in 2018 and 2019. The December 12 election in the United Kingdom paved the way for a Brexit with a deal removed another issue that had caused uncertainty in Europe and around the world. The US stock market was rising to new highs day after day. Unemployment was at the lowest level since the 1960s, and the US economy continued to grow at a moderate pace.
Markets across all asset classes suffered a correction in Q4 2018. An economic slowdown in China in late 2016 and early 2016 caused another speedbump in markets. Meanwhile, the 2008 global financial crisis stood as the worst threat to the worldwide economy since the Great Depression until the end of the first quarter of 2020.
A global pandemic hits markets like a tidal wave
In January, a mysterious virus in China began to infect thousands of people. With no treatment or vaccine, Coronavirus started to make many sick and claim the lives of a rising number of victims. In February, news that cases were popping up in South Korea, Iran, and Italy began to weigh on markets across all asset classes. As COVI-19 spread across the globe like wildfire, a tsunami of selling made the first quarter of 2020 a period that will go down in the history books. As we head into the second quarter of the year, the world faces the worst global pandemic since the 1918 Spanish flu, which claimed fifty to one hundred million lives.
On one of the first victims was the bull market in stocks
The bull market in the US stock market was born in 2009. It died in February 2020. The cause of death was COVID-19. On March 31, 2020, countries in Europe and Asia had closed borders and orders people to shelter in place. In the United States, President Trump extended social distancing guidelines from fifteen days until the end of April. Economic activity ground to a sudden halt for the first time in our lifetimes, and it remained that way at the end of last week with no end in sight.
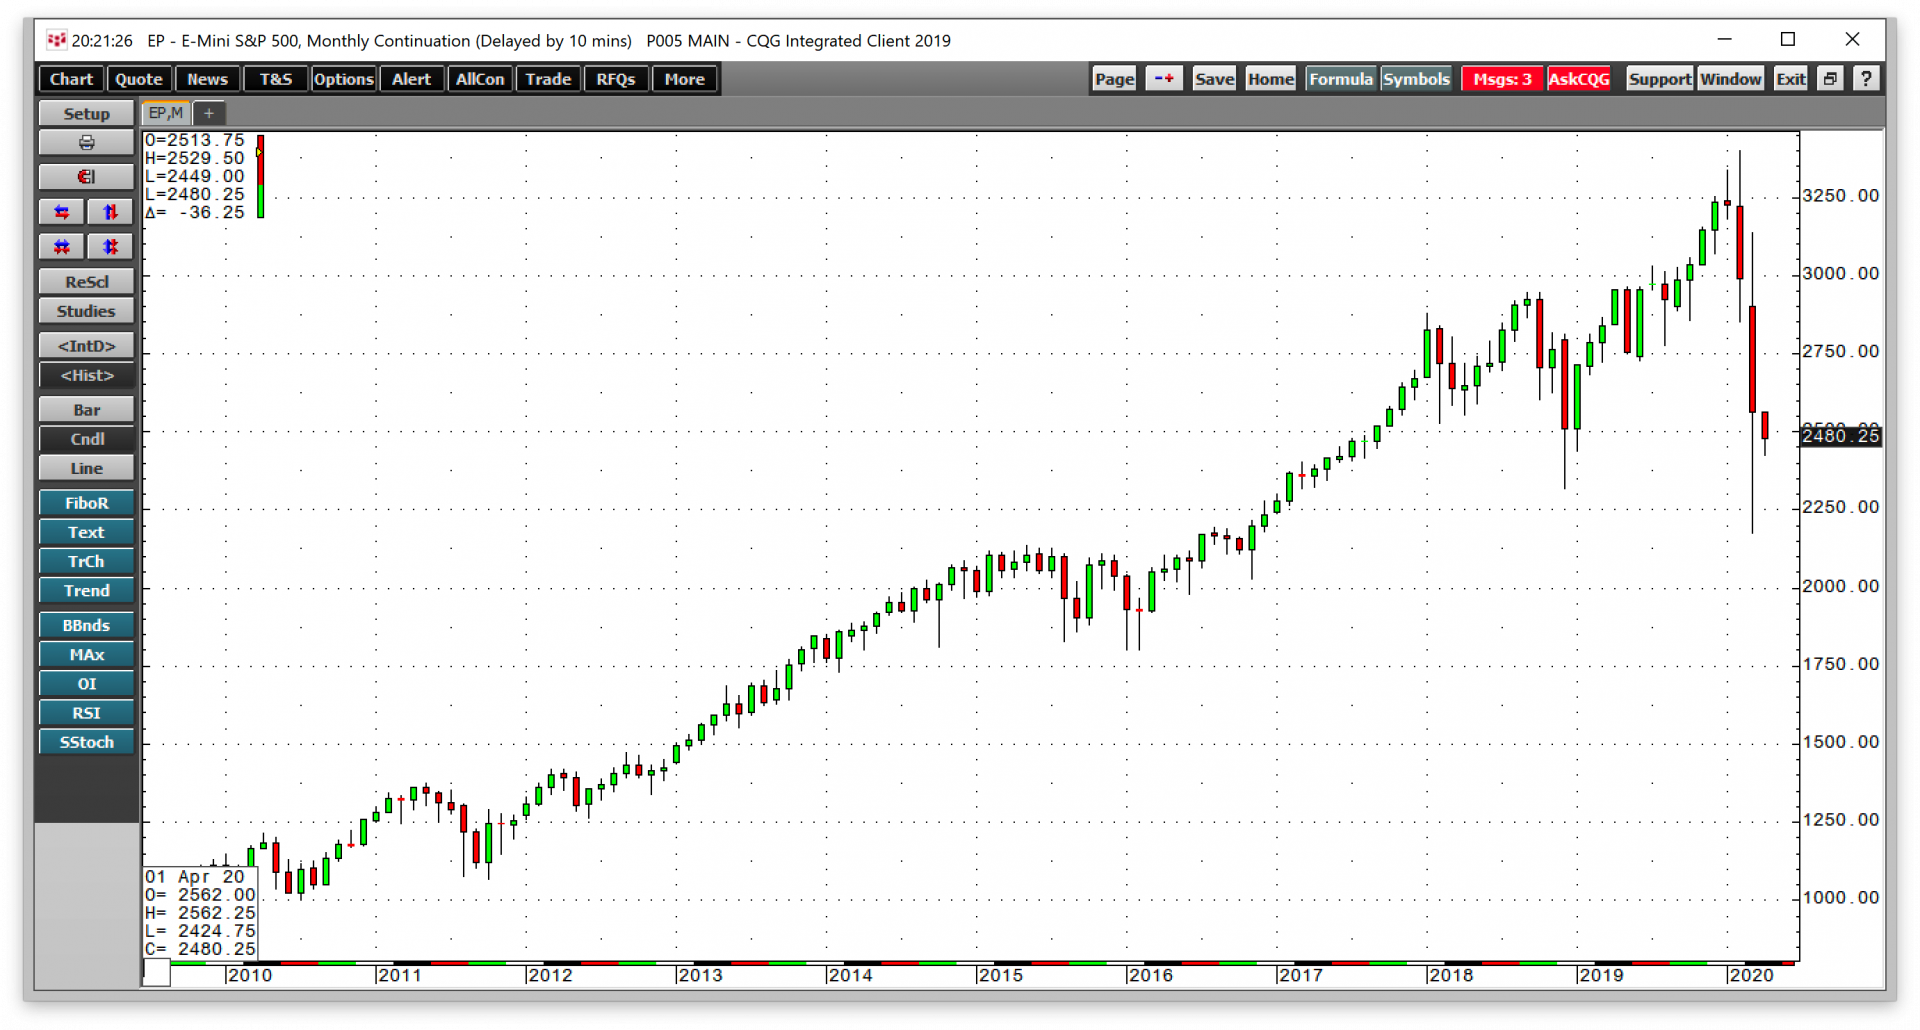
As the monthly chart of the E-Mini S&P 500 futures contract highlights, stocks put in a bearish reversal trading pattern in February. At the end of Q1, the pattern was the same in the quarterly chart.
The Fed and ECB responded to the deflationary spiral with unprecedented levels of monetary policy stimulus. The US central bank slashed the Fed Funds rate to zero percent. It fired bazookas fill with quantitative easing and liquidity at the financial system in an attempt to provide stability. The ECB followed with a 750-billion-euro liquidity package. The US government passed fiscal stimulus packages in the trillions. Unlike past events that caused deflationary periods in markets, the economic impact was a symptom of the virus. While central banks and governments continue to pull out all the stops to buy time, scientists around the world are scrambling to find a treatment and vaccine for the virus. Healthcare professionals are caring for the sick, and many are coming down with the virus. The answer to the worst global event in a century is in the hands of scientists, not economists and politicians. Science works slowly, while the virus spreads at lightning speed, and markets react in the blink of an eye.
Carnage in commodities
Commodities are global assets, and the deflationary event caused prices to sink. Meanwhile, the international oil cartel exacerbated problems in early March. Saudi Arabia and Russia decided to address demand destruction in the crude oil market by abandoning production quotas and flooding the world with the energy commodity. The price of crude oil tanked, and most other commodities followed.
The commodity asset class consisting of 29 of the primary commodities that trade on US and UK exchanges moved 17.77% lower in Q1 compared to the level at the end of the year that ended on December 31, 2019. Last year, the asset class gained 10.98%. In 2018 the asset class lost 6.82% of its value.
A few winners
During the period from January through March 2020, none of the commodity sectors posted gains. The two double-digit percentage gainers were FCOJ, which was 23.66% higher. The soft commodity recovered after spending most of the quarter below the $1 per pound level. Palladium was 20.71% higher, adding to gains of 59.48% in 2019. However, palladium became highly volatile during the risk-off selling caused by Coronavirus.
Soybean meal, a primary ingredient in animal feed, rose 7.20%, and rice a staple food around the globe was 6.85% higher. Gold rose 3.96% on the back of record stimulus that weighs on the value of fiat currencies. CBOT wheat and KCBT wheat were 1.79% and 1.44% higher, respectively. Only seven commodities posted gains over the first three months of 2020.
Massive losses led by the energy sector
The biggest loser for the quarter was the NYMEX crude oil that fell 66.46% with Brent crude oil in second place on the downside with a 65.40% loss in Q1. The price of nearby NYMEX gasoline futures fell 64.94% over the period.
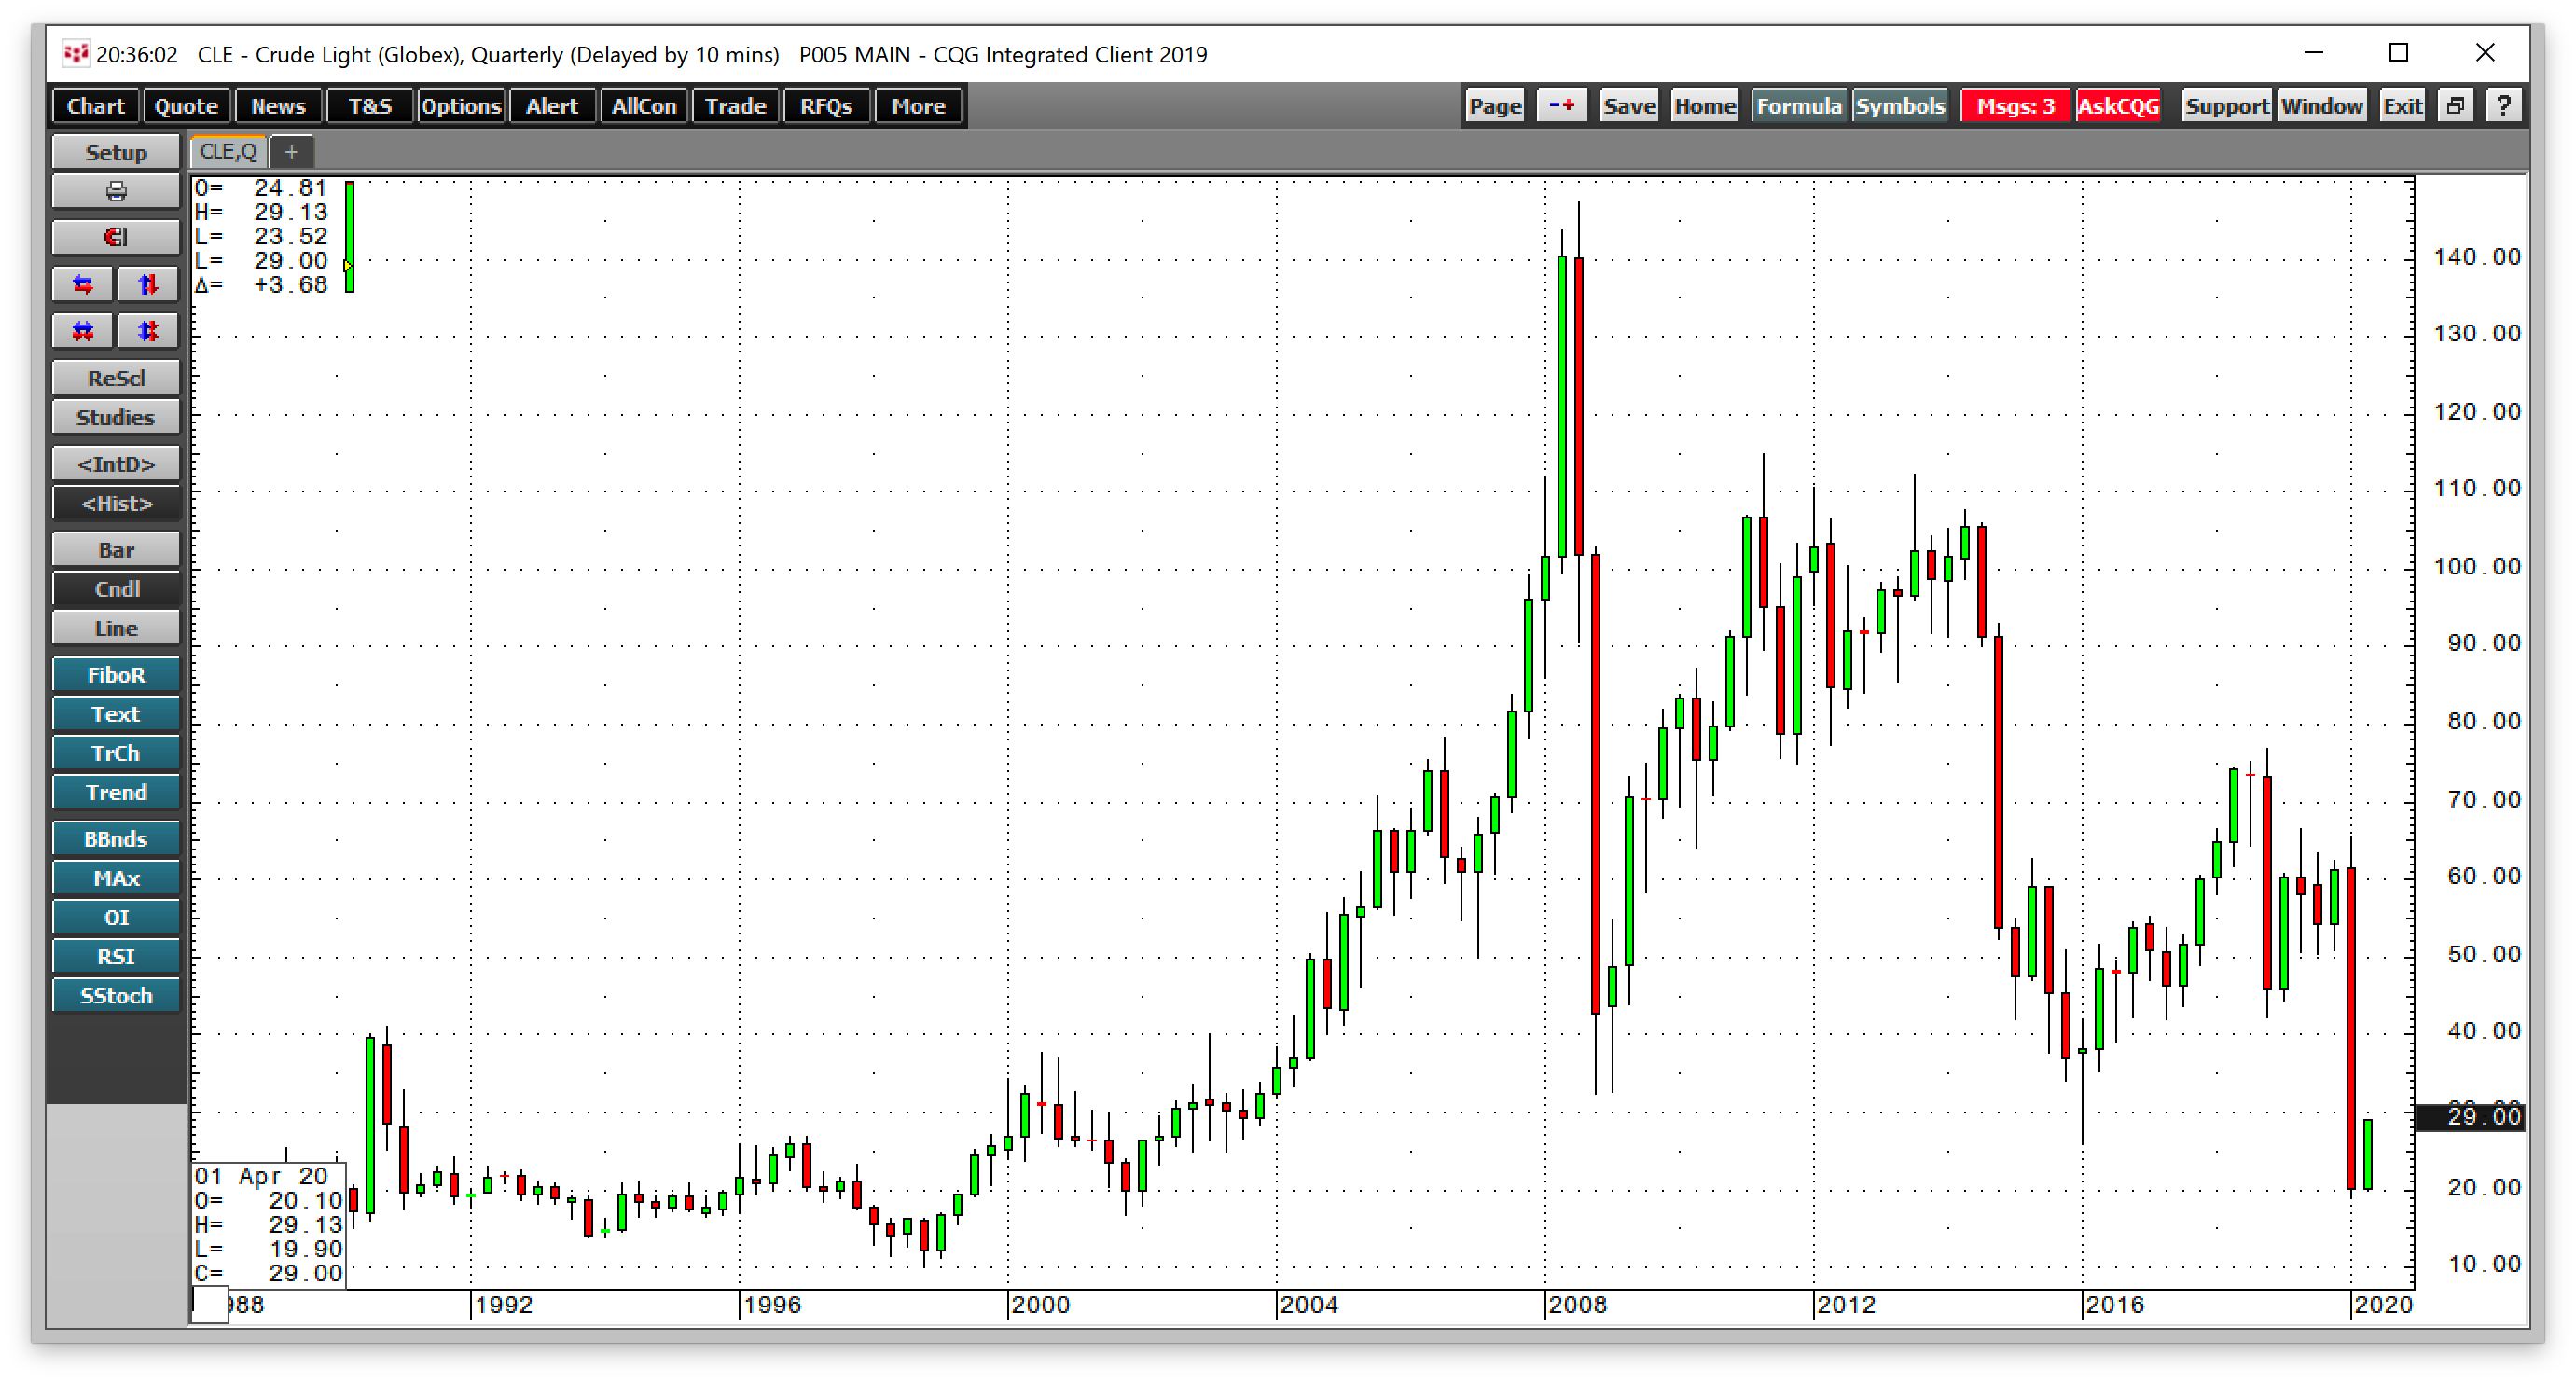
The quarterly chart of nearby NYMEX crude oil futures shows that the energy commodity traded in a range from a high of $65.65 per barrel in early January to a low of $19.27 in late March. Like the stock market, crude oil put in a bearish reversal on the quarterly chart.
The commodities that fell over 50% included heating oil futures that were 50.49% lower. The Baltic Dry Index fell 49.72%.
Ethanol, the biofuel shed 33.75% on the back of weak gasoline prices. Corn is the primary ingredient in ethanol production in the US, and sugar is the input in Brazil.
Both corn and sugar prices posted double-digit percentage losses in Q1. Lumber declined by 31.29%.
Many commodities were down over 20% for the quarter, including a 26.92% drop in the price of lean hogs, a 25.95% loss in cotton, a 25.43% drop in platinum, and a 25.08% decline in natural gas futures. Copper on the LME fell 22.17%, and on COMEX, the red metal lost 20.34%. Sugar futures moved 22.35% to the downside, and soybean oil lost 21.69%, and silver was down 21.09%.
Those commodities losing between 10% and 20% were LME nickel with a loss of 19.73%, LME zinc down 17.93%, LME aluminum down 16.68%, feeder cattle futures off 16.10%, and LME tin which lost 14.78% of its value. The price of corn futures fell 12.12%, while cocoa was 11.46% lower. LME lead was the best-performing nonferrous metal, but it dropped 11.23%.
Iron ore fell 9.66%, coffee lost 7.83%, and MGE wheat was 3.88% lower.
Gasoline and heating oil processing spreads reflected demand destruction in Q1. The gasoline processing spread fell 56.84% as people in the US and around the world remained in their homes. However, the smaller decline of 10.25% in the heating oil crack spread reflected the continued operation of the supply chain bringing goods to market. Heating oil is a distillate fuel that is a proxy for diesel and jet fuels. While airline travel is declining dramatically, trucks are bringing goods to he market to feed people during the pandemic.
As we head into Q2, we need to put our faith in scientists who will eventually provide treatments and a vaccine. In the meantime, the deflationary spiral is likely to continue. All of the liquidity from central banks and fiscal stimulus from governments comes at an unprecedented price tag. When Coronavirus fades into history, cleaning up the economic rubble in its wake could take years, if not decades.