This Microsoft Excel® dashboard displays today’s open interest and traded volume for all of the strikes by month for both call and put options on futures. In addition, the current put/call ratio and previous session’s traded volume and open interest are displayed.
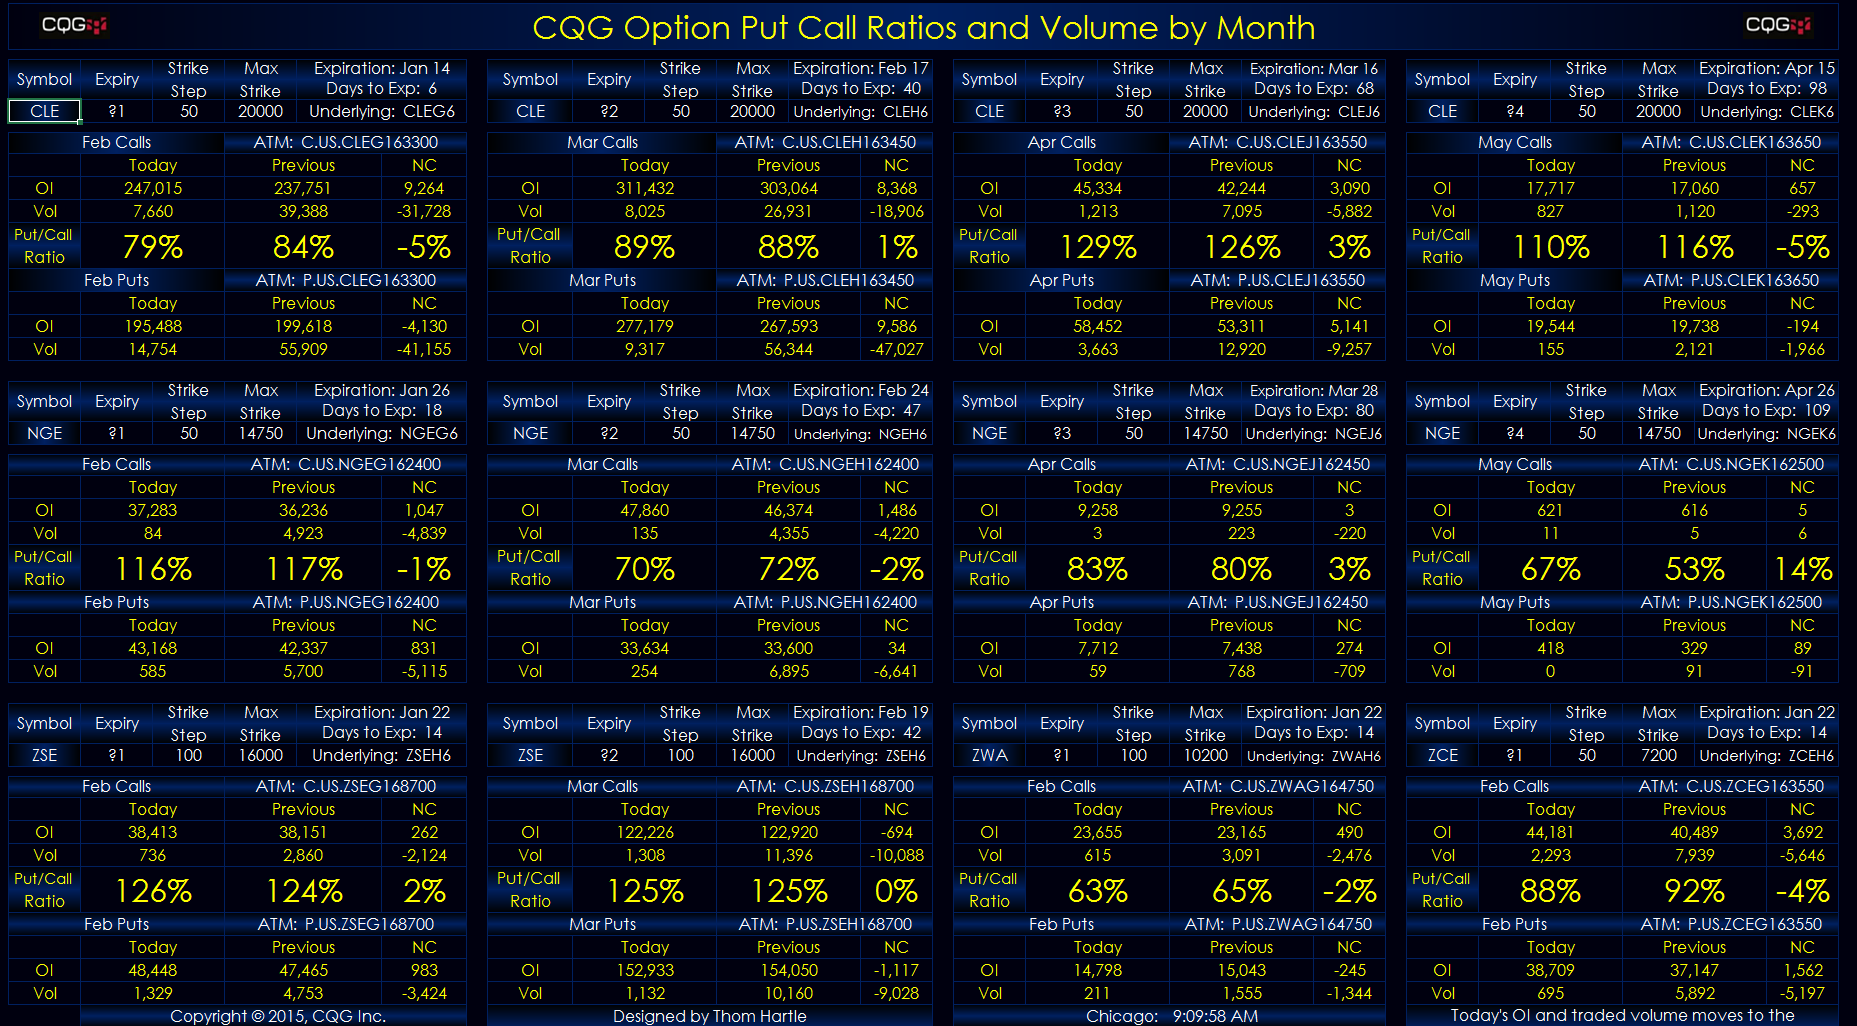
You enter the underlying symbol, the expiry (either by wild card or month and two-digit year), the strike steps, and the maximum strike. You can find which maximum strike to use by opening the Options window in CQG and scrolling to the bottom.
When Excel pulls in the at-the-money (ATM) option symbols, they are the current symbols. To update the current ATM symbols, just restart the dashboard. Also, prior to the evening session opening, all of the current day’s data is moved to be listed as the previous day’s data.
Requires CQG Integrated Client or CQG QTrader, data enablements for all symbols displayed in this spreadsheet, and Excel 2010 or more recent.