This Microsoft Excel® spreadsheet presents two views of the E-mini S&P contract. The left-hand view displays candlestick bars using CQG’s proprietary TFlow chart data. You can use the aggregation feature and compress up to twenty individual TFlow bars into one TFlow bar by changing the parameter in the upper left-hand part of the display.
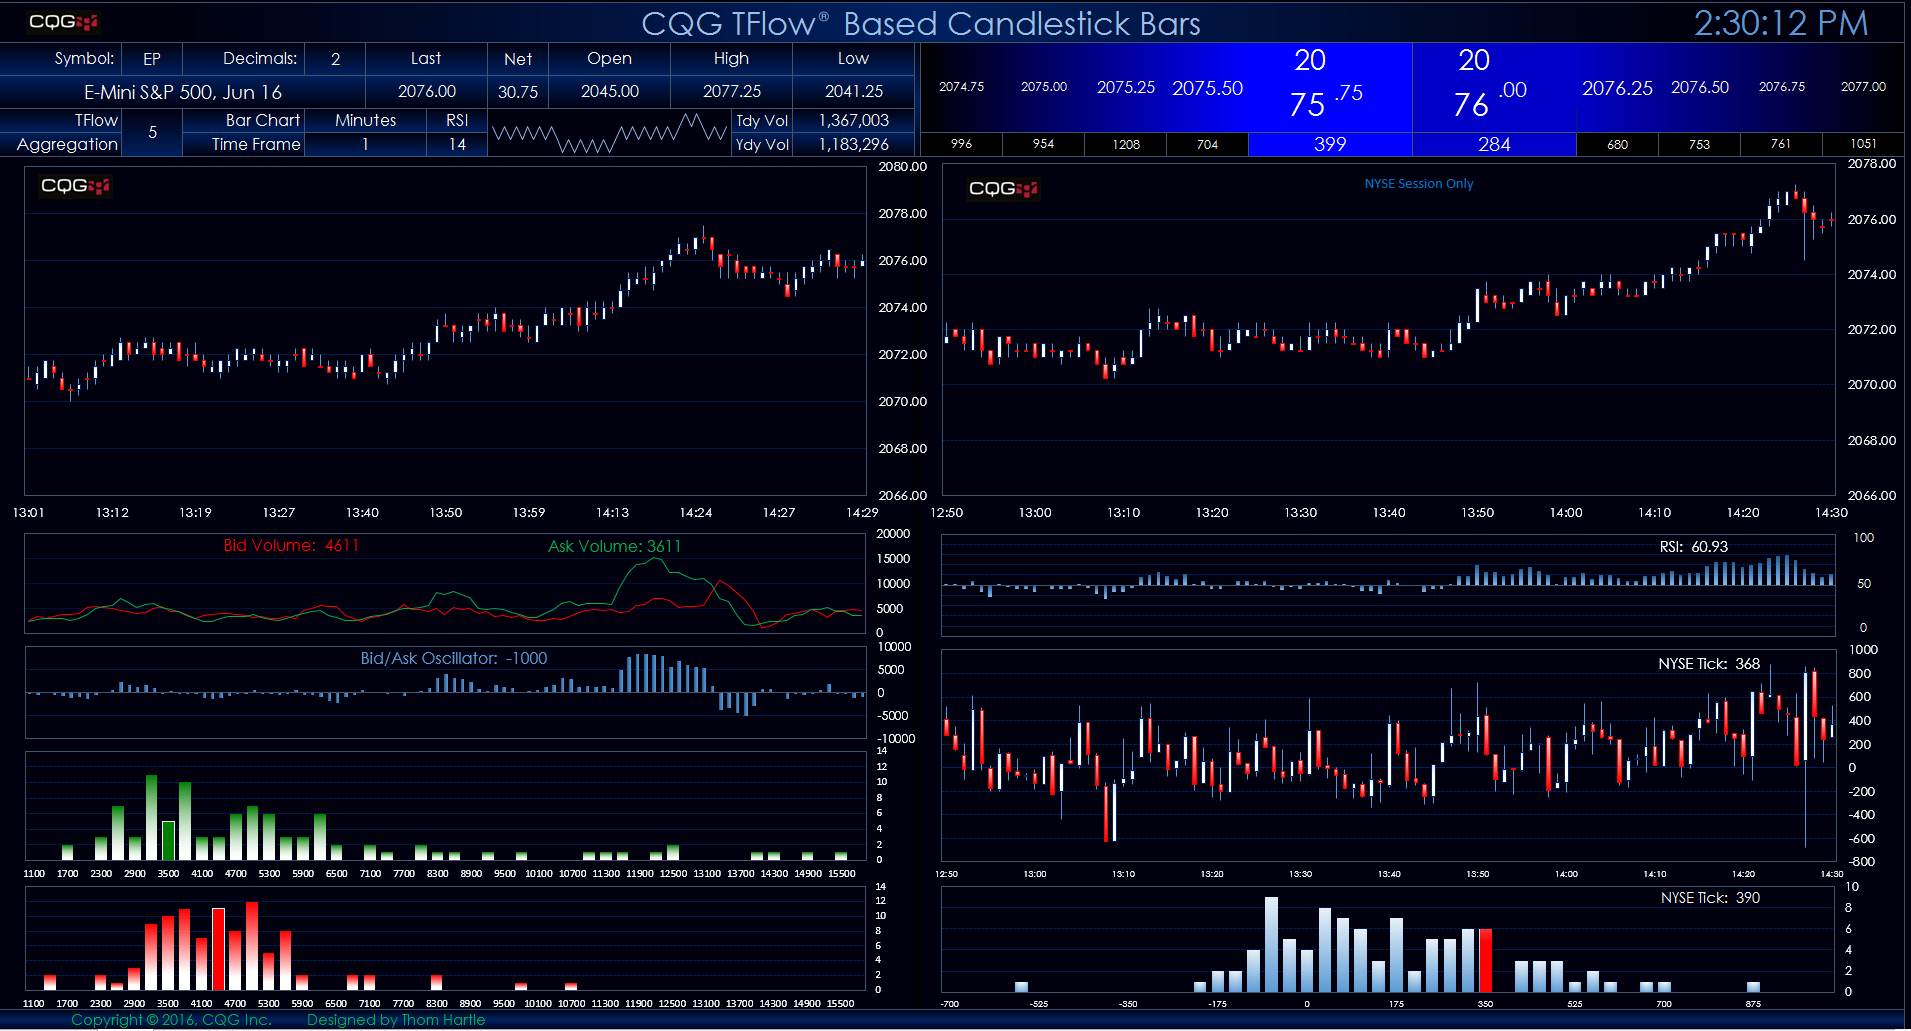
Below the TFlow candlestick charts are the Bid/Ask Volume Oscillator Studies. These studies track the amount of volume executed at the bid and ask prices using a five-bar rolling sum. You can learn more about the studies (and CQG QTrader users can download the pac to install the two studies) here.
Below the Bid/Ask Volume Oscillator Studies are two frequency distribution displays. Frequency distribution analysis simply counts the number of times a particular value occurs in a range of values. A simple explanation of frequency distribution analysis is found here. These displays show the number of times the bid volume oscillator and the ask volume oscillator had readings within the last 100 TFlow bars. The current reading for each study is the highlighted histogram bar in the frequency distribution charts.
The right-hand side of the dashboard has an intraday candlestick chart. You can change the number of minutes by changing the parameter in the upper left-hand part of the display. This chart uses the NYSE trading session. You must install the pac with the custom session. Below the candlestick chart is the Relative Strength Index study. It display histogram bar values relative to 50 on the vertical scale.
Below the candlestick chart is the NYSE Tick index. This is the number of stocks trading on an uptick minus the number of stocks trading on a downtick. This is a sensitive short-term oscillator.
Below the Tick chart is a frequency distribution chart showing the current reading (the highlighted histogram bar) in the range of values over the last 100 bars.