CQG IC and QTrader offer charts that utilize volume for the horizontal scale, not time. The first chart type to discuss is Constant Volume Bars.
Constant Volume Bar (CVB)
The Constant Volume Bar chart uses a customer selected parameter of traded volume (either exchange volume or tick volume) to complete the building of each bar. Time is not a factor.
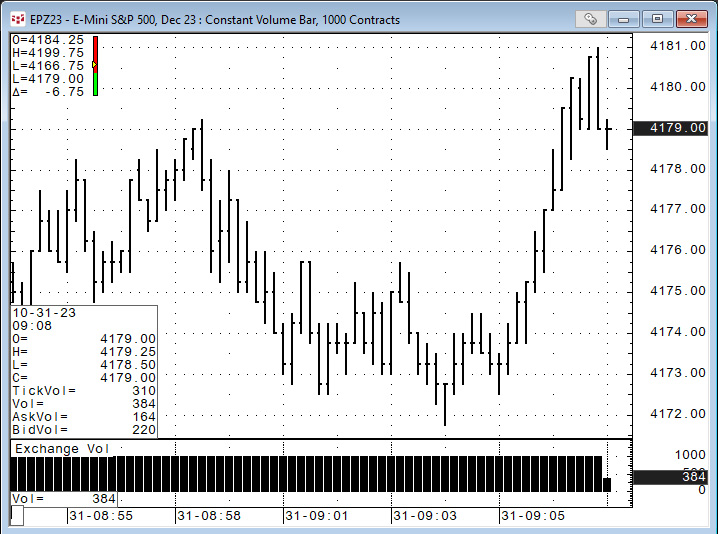
In the above image, the price action (open, high, low, and close) of each bar in a Constant Volume Bar chart contains a specified volume level. In this example, the volume parameter is 1,000 contracts. When the volume level is reached, the next Constant Volume Bar begins to build. Displaying the current volume gives you an idea of how close the current bar is to completion.
For ease of use the date and time is displayed on the horizontal axis.
More information about the Constant Volume Bar chart is available from the Help file.
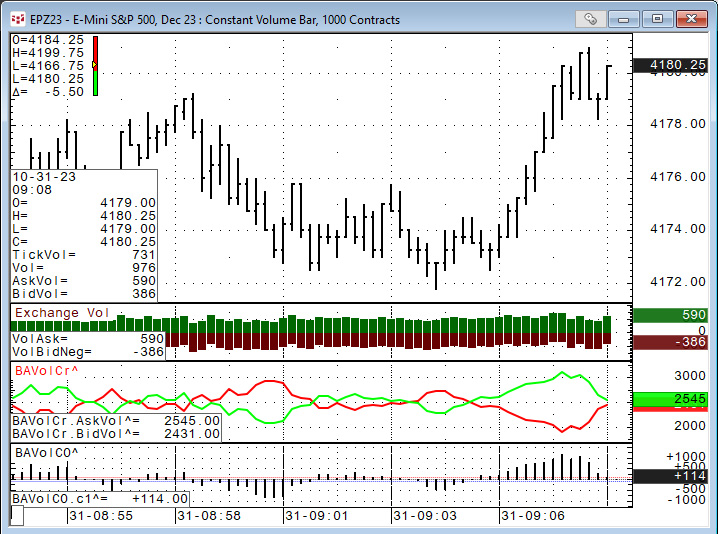
All volume studies and price-based studies work with CVB charts. For example, in CQG's custom studies there are two studies: BAVolCross and BAVolCrOsc. In long hand, these two are Bid Ask Volume Cross and Bid Ask Volume Cross oscillator. The two studies use the traded bid volume and the ask volume for the calculations. The studies have a parameter "Running Sum", and the default setting is 5-bars. In the chart below the green line is buying volume, and the red line is selling volume. The BAVolCrOsc study is the difference between bid volume and ask volume running sum values.
TFlow (TFlow)
The next chart type is the TFlow chart. TFlow bars are built from DOM data and each TFlow bar is based on the following rules:
- TFlow bar low that indicates the lowest bid traded at the start of the bar. If no trades occurred at the bid, this value is the best bid.
- TFlow bar high that indicates the highest ask traded at the start of the bar. If no trades occurred at the ask, this value is the best ask. The open and close are not indicated on the TFlow bar.
- Bid volume (BV) that indicates the volume of the trades at the bid side accumulated over the bar.
- Ask volume (AV) that indicates the volume of the trades at the ask side accumulated over the bar.
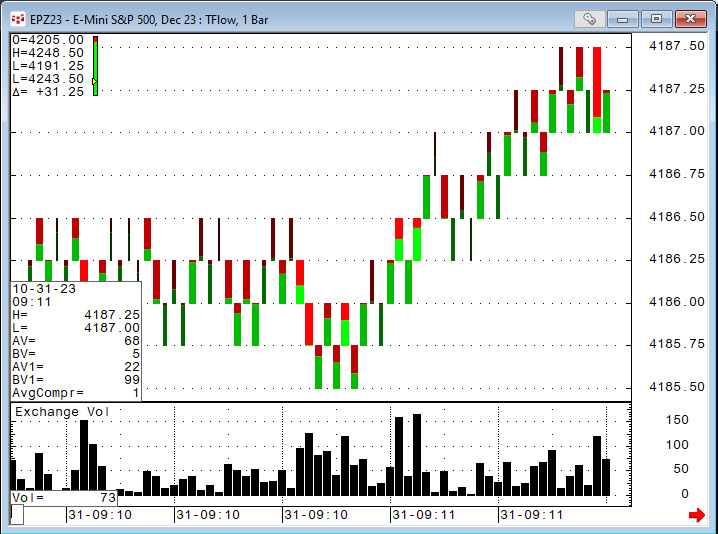
The above image displays 1 bar TFlow bars. Most of the time the best bid and ask are 1 tick apart so the typical range of the TFlow bars are 1 tick. Notice, the bars are colored, and the width varies. The default parameter for the TFlow bars for the width of the bar is colored based on the Percent of Average volume. The values are percentages of average volume, calculated as the arithmetic mean of total volume of all bars in the same session from the previous trading day.
The coloring is green for the percentage of volume executed at the ask and red for the volume of trades executed at the bid. For example, the last bar has ask volume of 68 contracts and bid volume of 5 contracts for a total of 73. The bar is almost entirely green as the volume traded at the ask is a high percentage of the total volume for the bar.
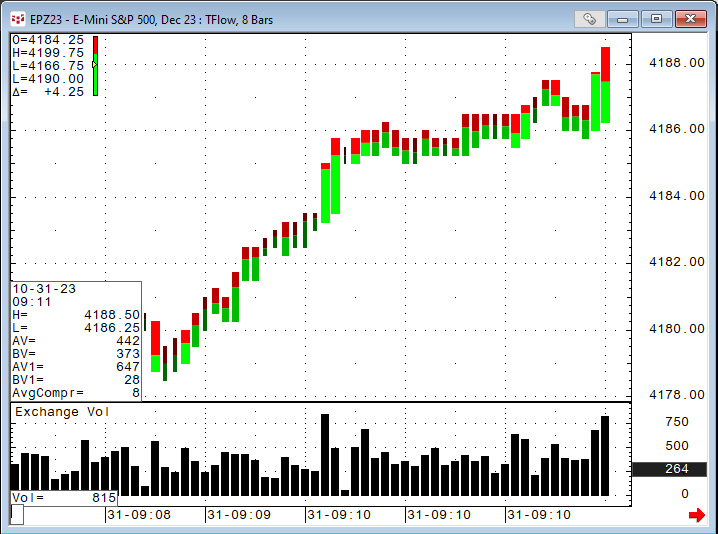
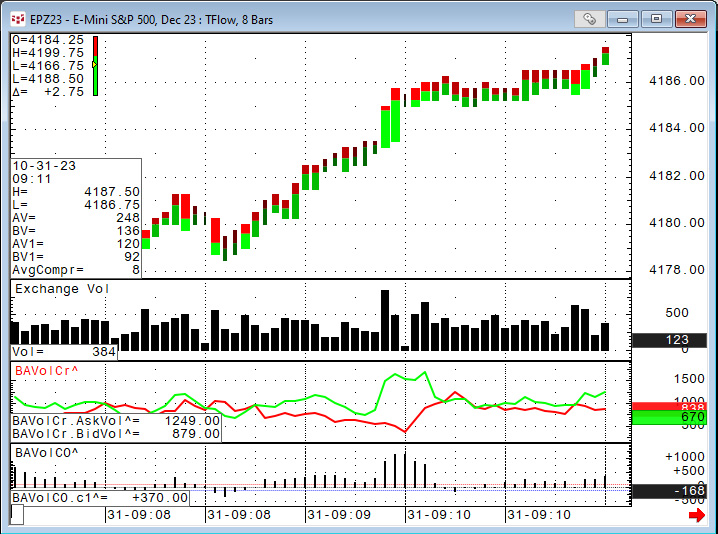
The TFlow bars can be aggregated. This image below displays TFlow bars composed of 8 individual single TFlow bars.
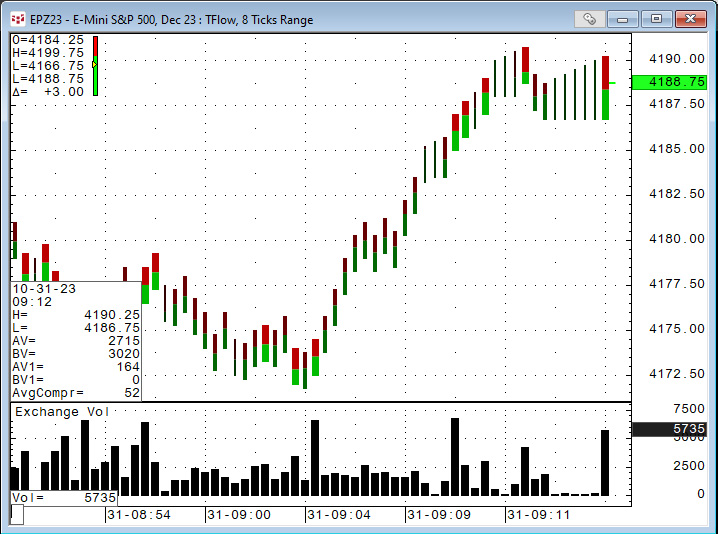
TFlow bars can be aggregated by a price range. The image below is using a range of 8 ticks.
TFlow bars can be set to using a proprietary smoothing algorithm.
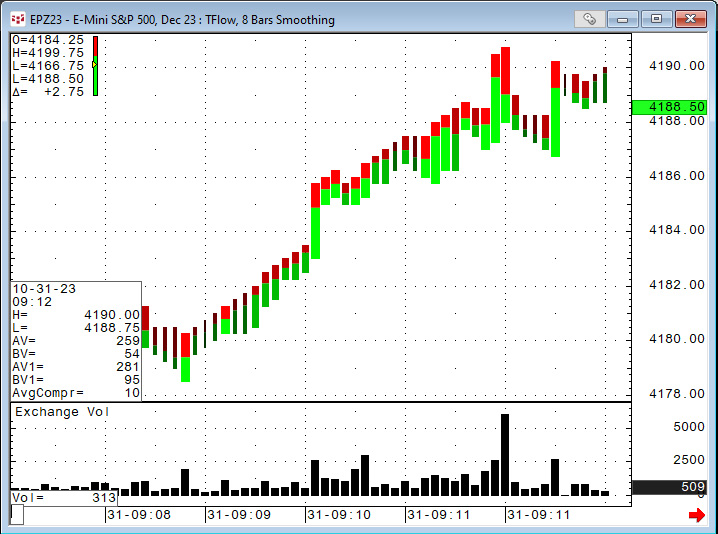
More information is available from the Help file.
And, TFlow bar can have studies applied to the TFlow Bars. The same two volume studies detailed in the Constant Volume Bar chart section are displayed in the image below.
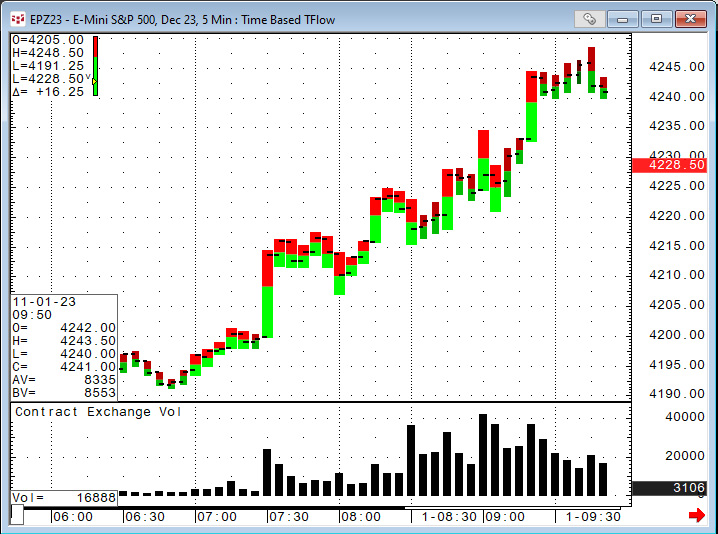
Time-Based TFlow (TTFlow)
One additional chart type is the Time-Based TFlow (TTFlow). This is a classic bar chart, but with coloring and size based on the TFlow chart algorithm. Time-based bars appear as TFlow bars with open and close markers.
The Time-Based TFlow chart displays bars built based on Time & Sales data similar to regular time based bars, but with the addition of bid and ask volume. Bid and ask volume is available intraday only. This chart also provides access to historical data.
The bid volume is represented by the red part of the bar, and the ask volume is green. The color brightness and the width of Time-Based TFlow bars are based on the current bar's volume relative to the volume history. The preferences offer four preset colors/widths. The higher the volume then the brighter and wider the bars.
You choose one of three ways to determine the current bar's volume relative to the volume history: percent ranking, percent of average, and actual.
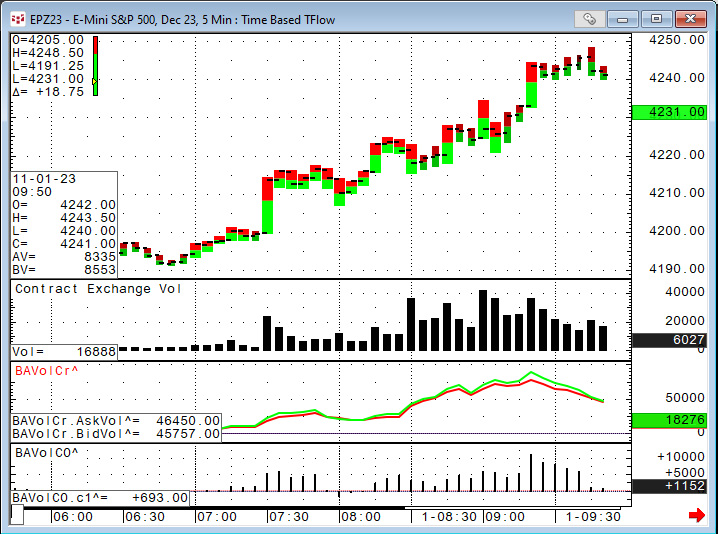
TTFLow charts can be used with the same contracts and studies that you use with a regular time bar. Volume information is not displayed if time and sales trade volume is unavailable.
More details are available from the Help file.
In conclusion, CQG has long held a reputation for its charting and analytics displays. These three chart types: Constant Volume Bars, TFlow Bars, and Time Based TFlow Bars offer technical traders unique ways to monitor market activity.