The Net Change Curve chart displays a collection of symbols’ daily net price change or daily net percentage change making it easy to compare on a relative basis each market’s current session’s performance. In addition, you can choose to set the net change curve chart to the current time and see the performance from that starting time. This is useful to gauge the price action of a group of symbols following an economic release. Finally, the Net Change Curve chart can track a collection of symbols that represent a forward curve, such as a crude oil forward curve.
At the bottom of this post is a collection of CQG PACS that focus on various markets by groups, such as energy, grains, and equities.
To build your own Net Change Curve charts, please review the Help file.
An example of using the Net Change Curve chart to compare the performance of Forex Futures is displayed below.
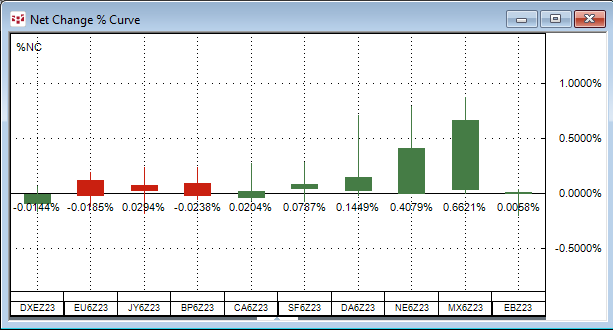
Above, the Net Change Curve chart is set to show percentage net change. With a simple glance the relative performance comparison is realized.
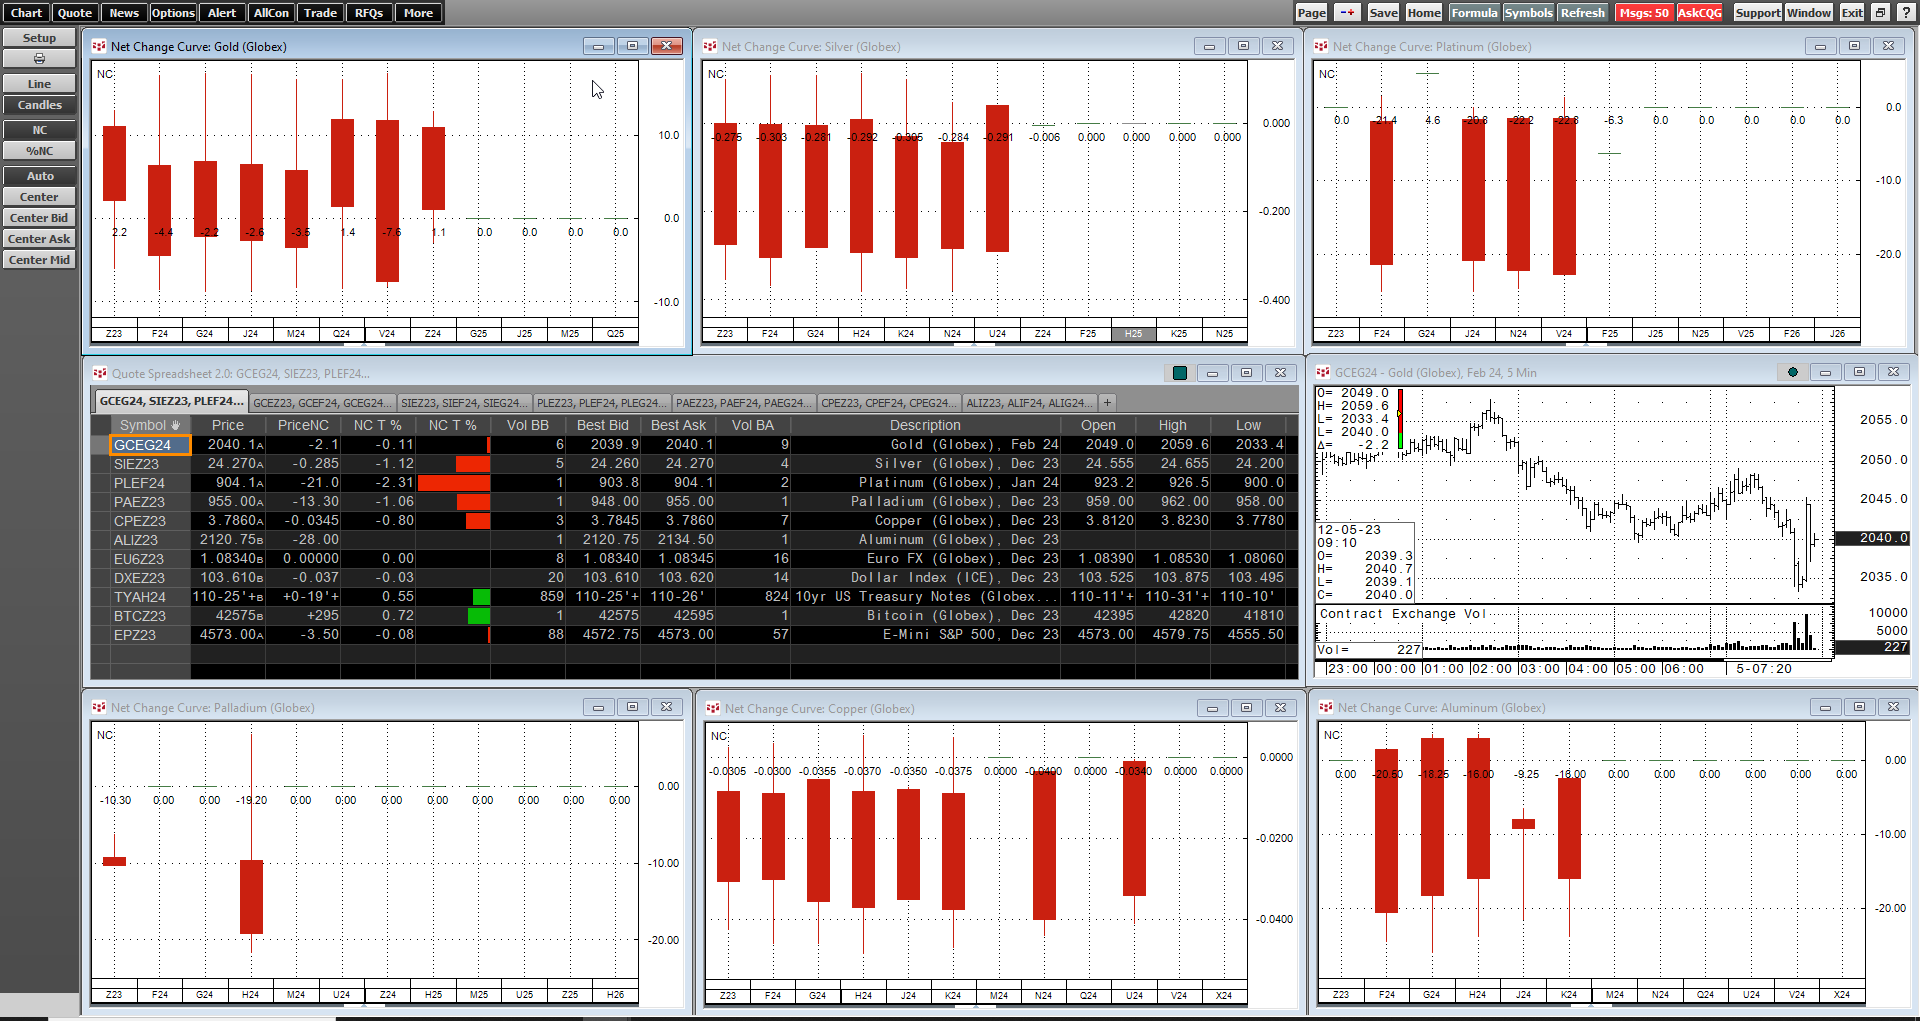
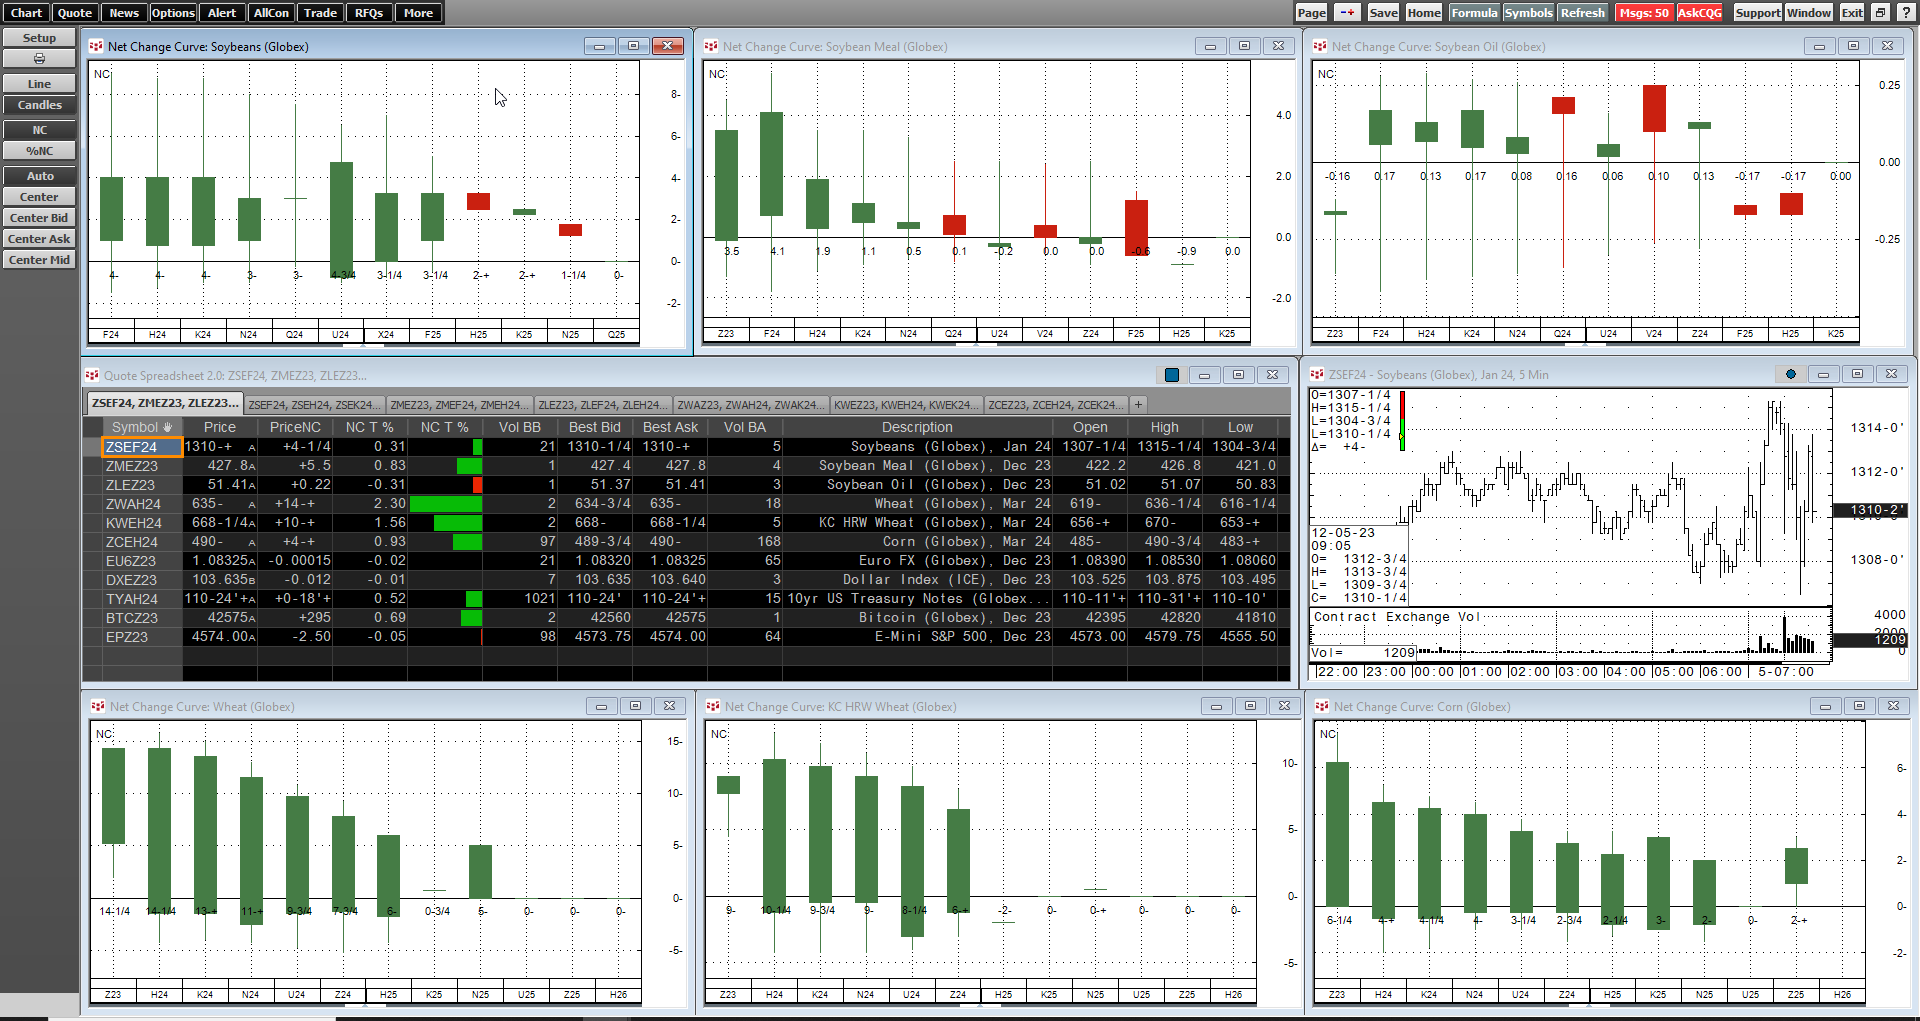
To gauge the relative performance of the symbols comprising a forward curve you set the chart to use “NC” and now in view is the price net change for every contract.
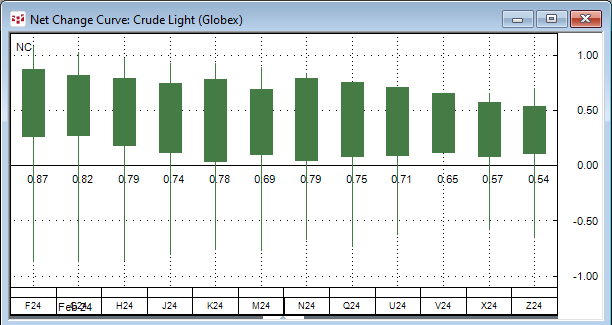
This feature enables you to see the shifting values of each contract on the forward curve.
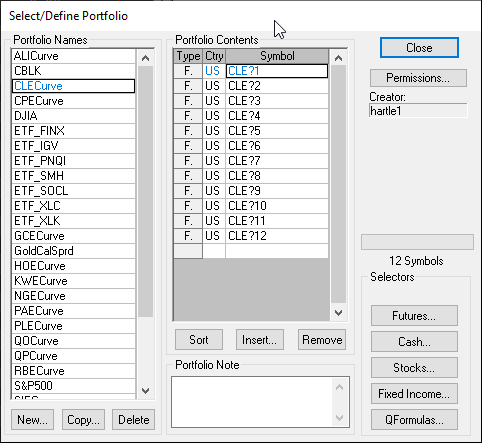
The easiest way to build a Net Change Curve chart is to first build a portfolio of the symbols and then have a Net Change Curve chart open and open the Portfolio from a right-click on the symbol axis. The Help File covers the steps.
There are four PACs available to download and install in CQG IC or QTrader.
This is an image of the Energy page.
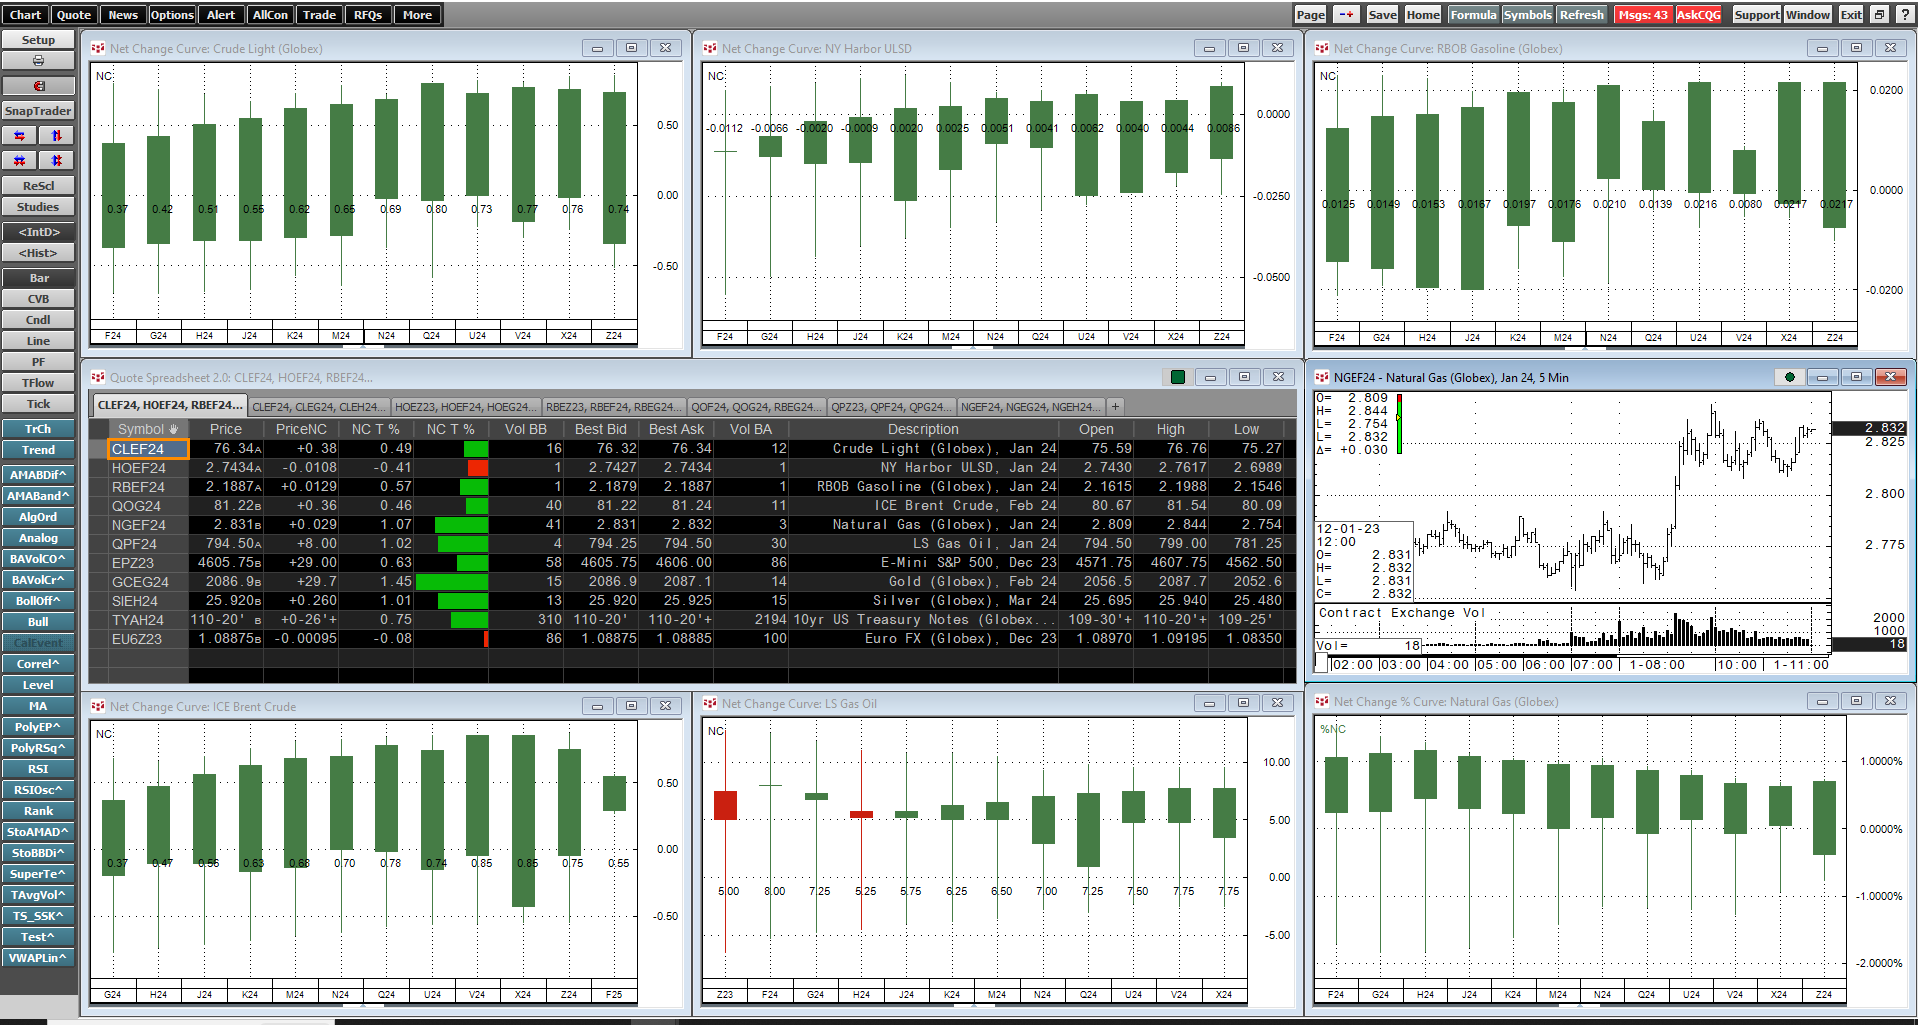
The Quote Spreadsheet V2 has a tab for market data for each NC Forward Curve chart.
This is an image of the Metals page.
This is an image of the Grains page.
This is an image of the Equities page.
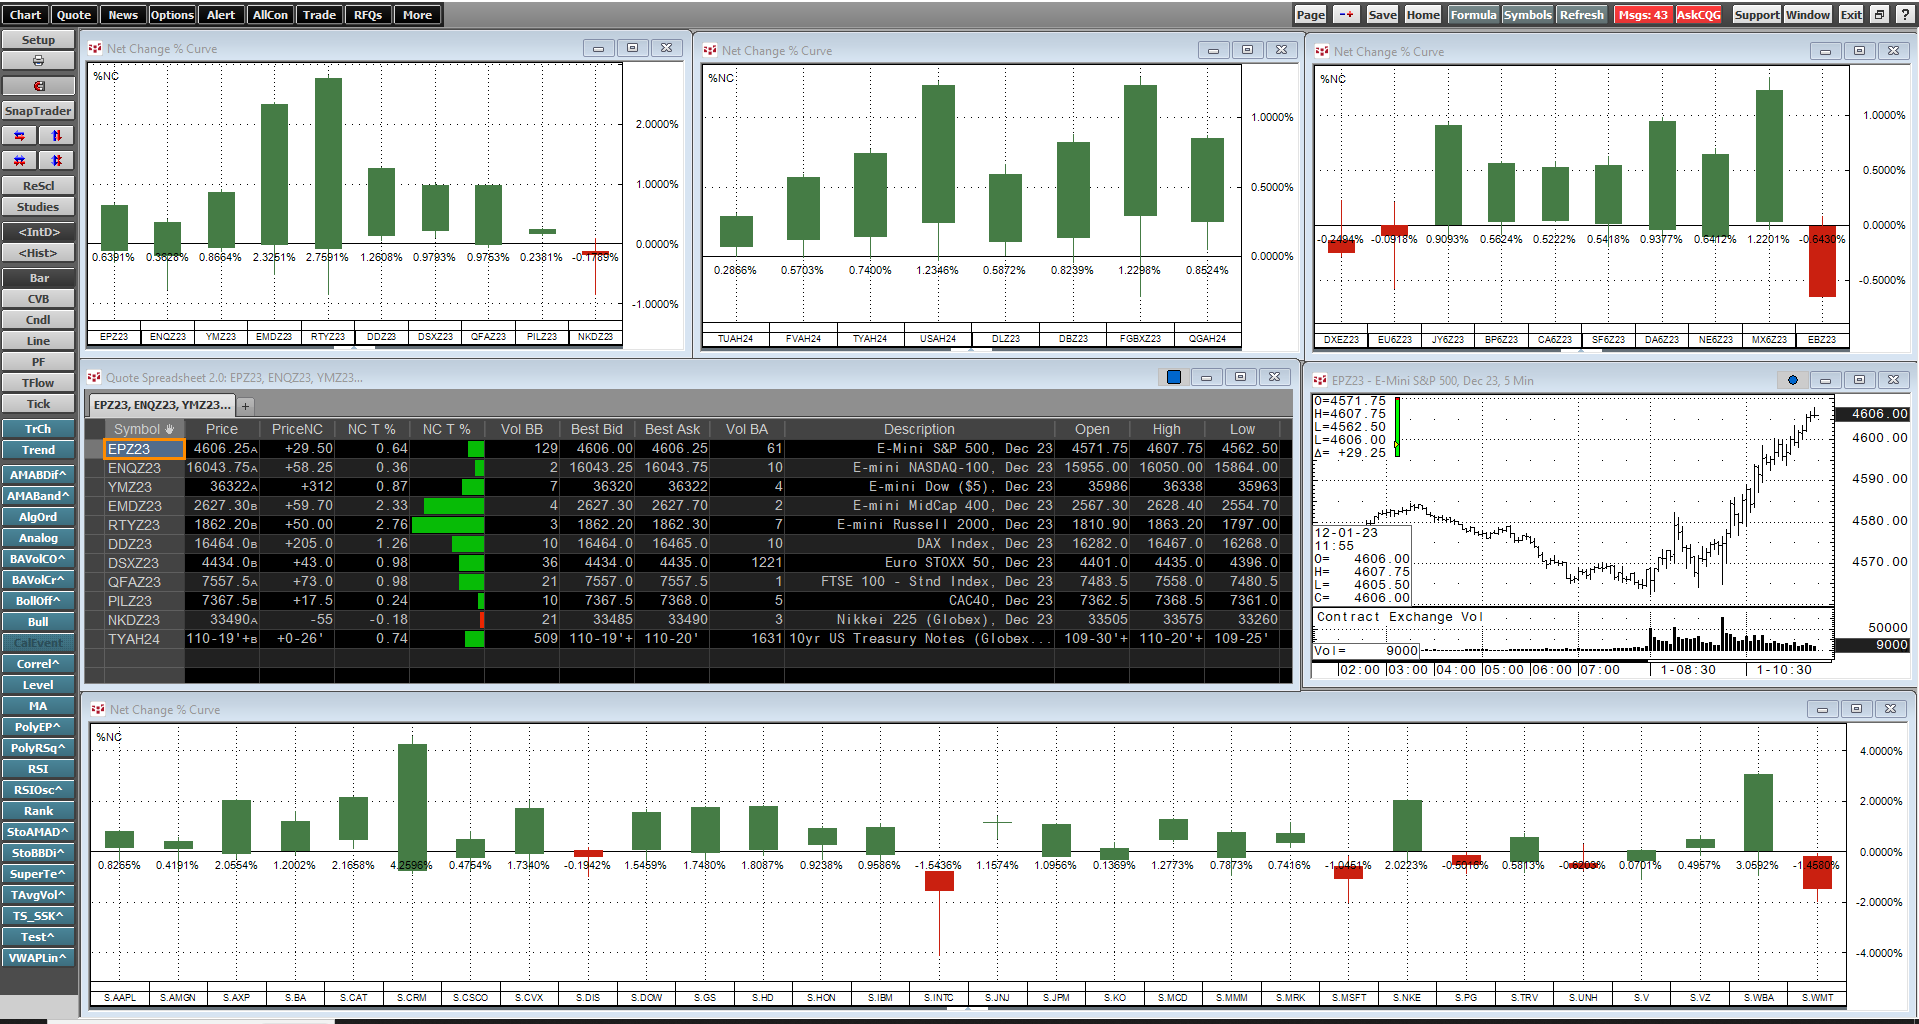
The Equities page has a percent Net Change curve chart of the 30 stocks in the Dow Jones Industrial average.