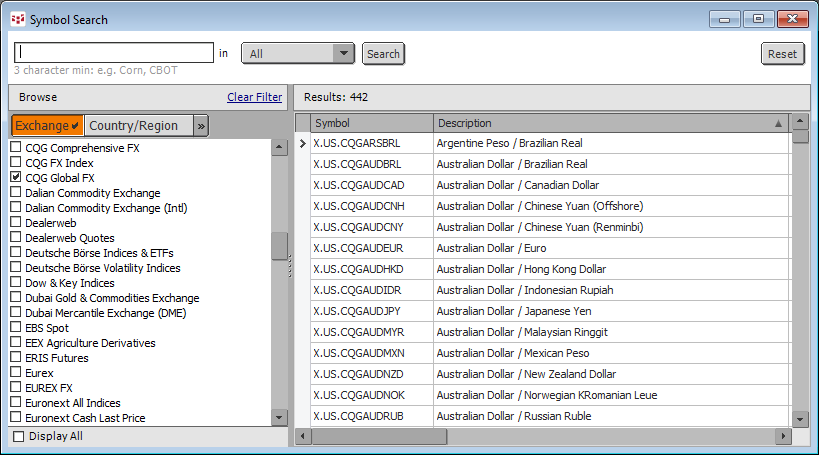
CQG offers institutional pricing data across 430+ currency pairs of market data. Sourced directly from tier-1 banks and non-bank market makers worldwide, the feed provides up to 50 years of historical data across multiple timescales is available. The enablement is CQG Global FX.
This post offers IC/QTraders a downloadable CQG PAC that is a page utilizing CQG's Portfolio Monitor to display market data as well as a downloadable Excel spreadsheet with similar market information.
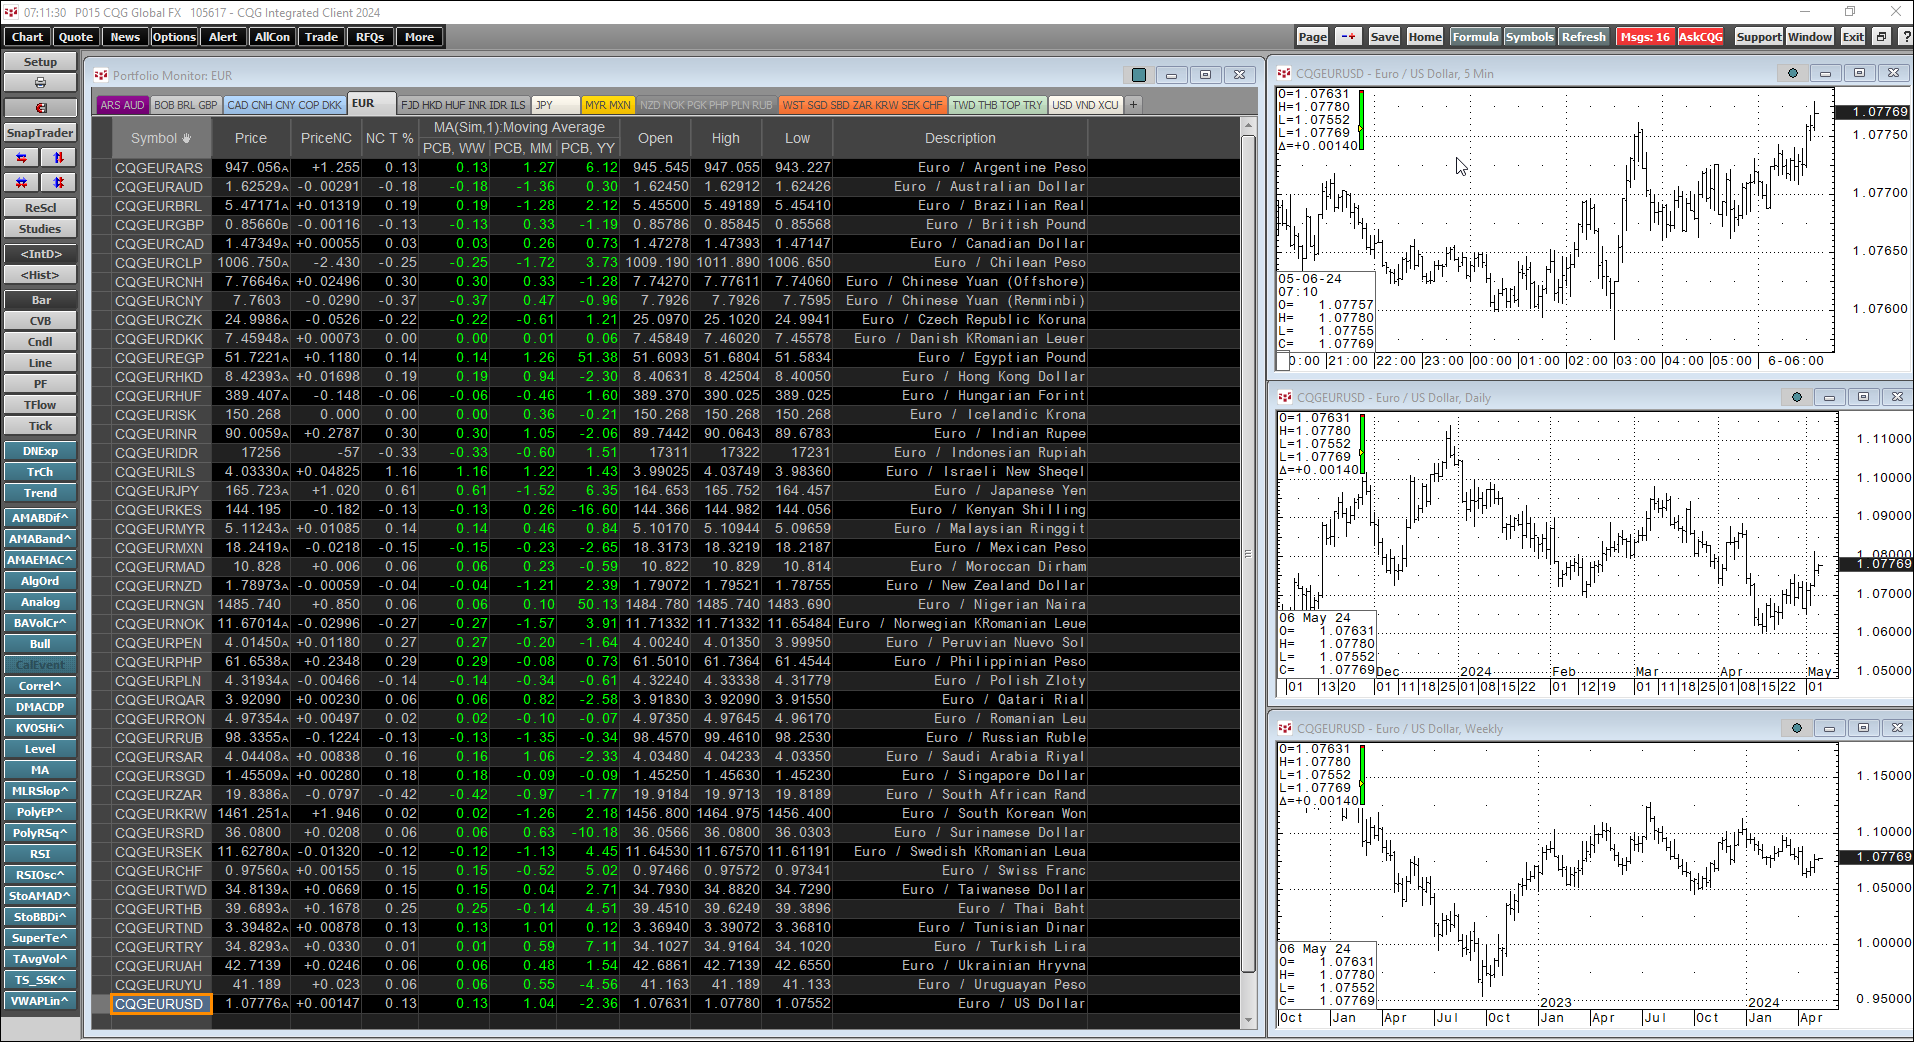
The full page displayed above has tabs that group the markets by the base currency symbol of the pairs.
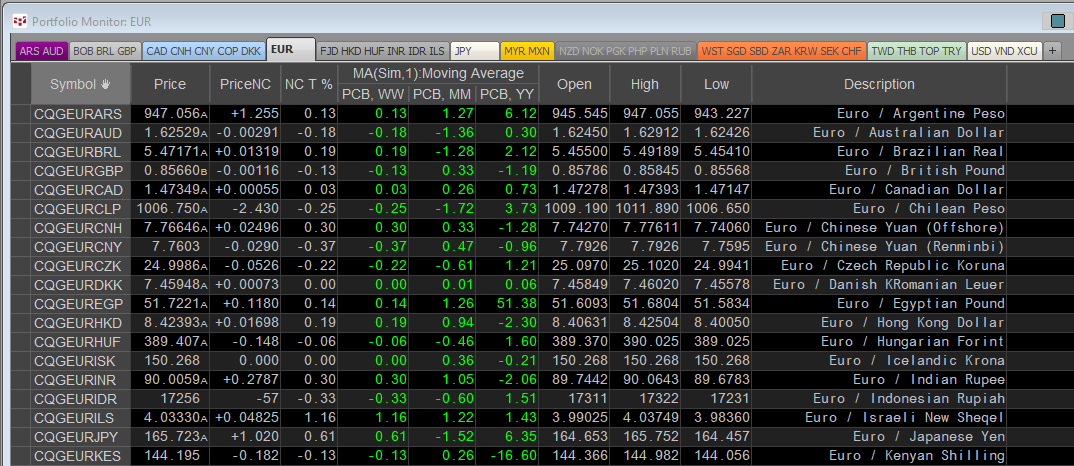
The three columns with the yellow fonts are weekly, monthly, and annual percent net change. The monitor is linked to three charts (5-minute, daily, and weekly).
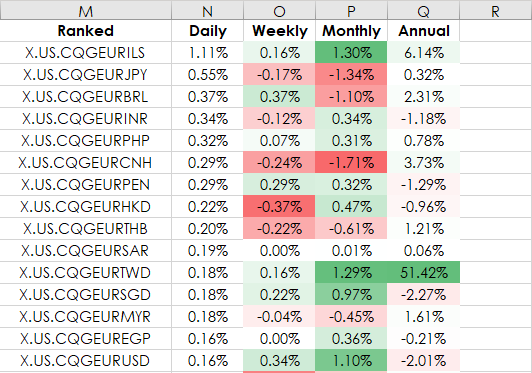
The Excel spreadsheet has similar information.
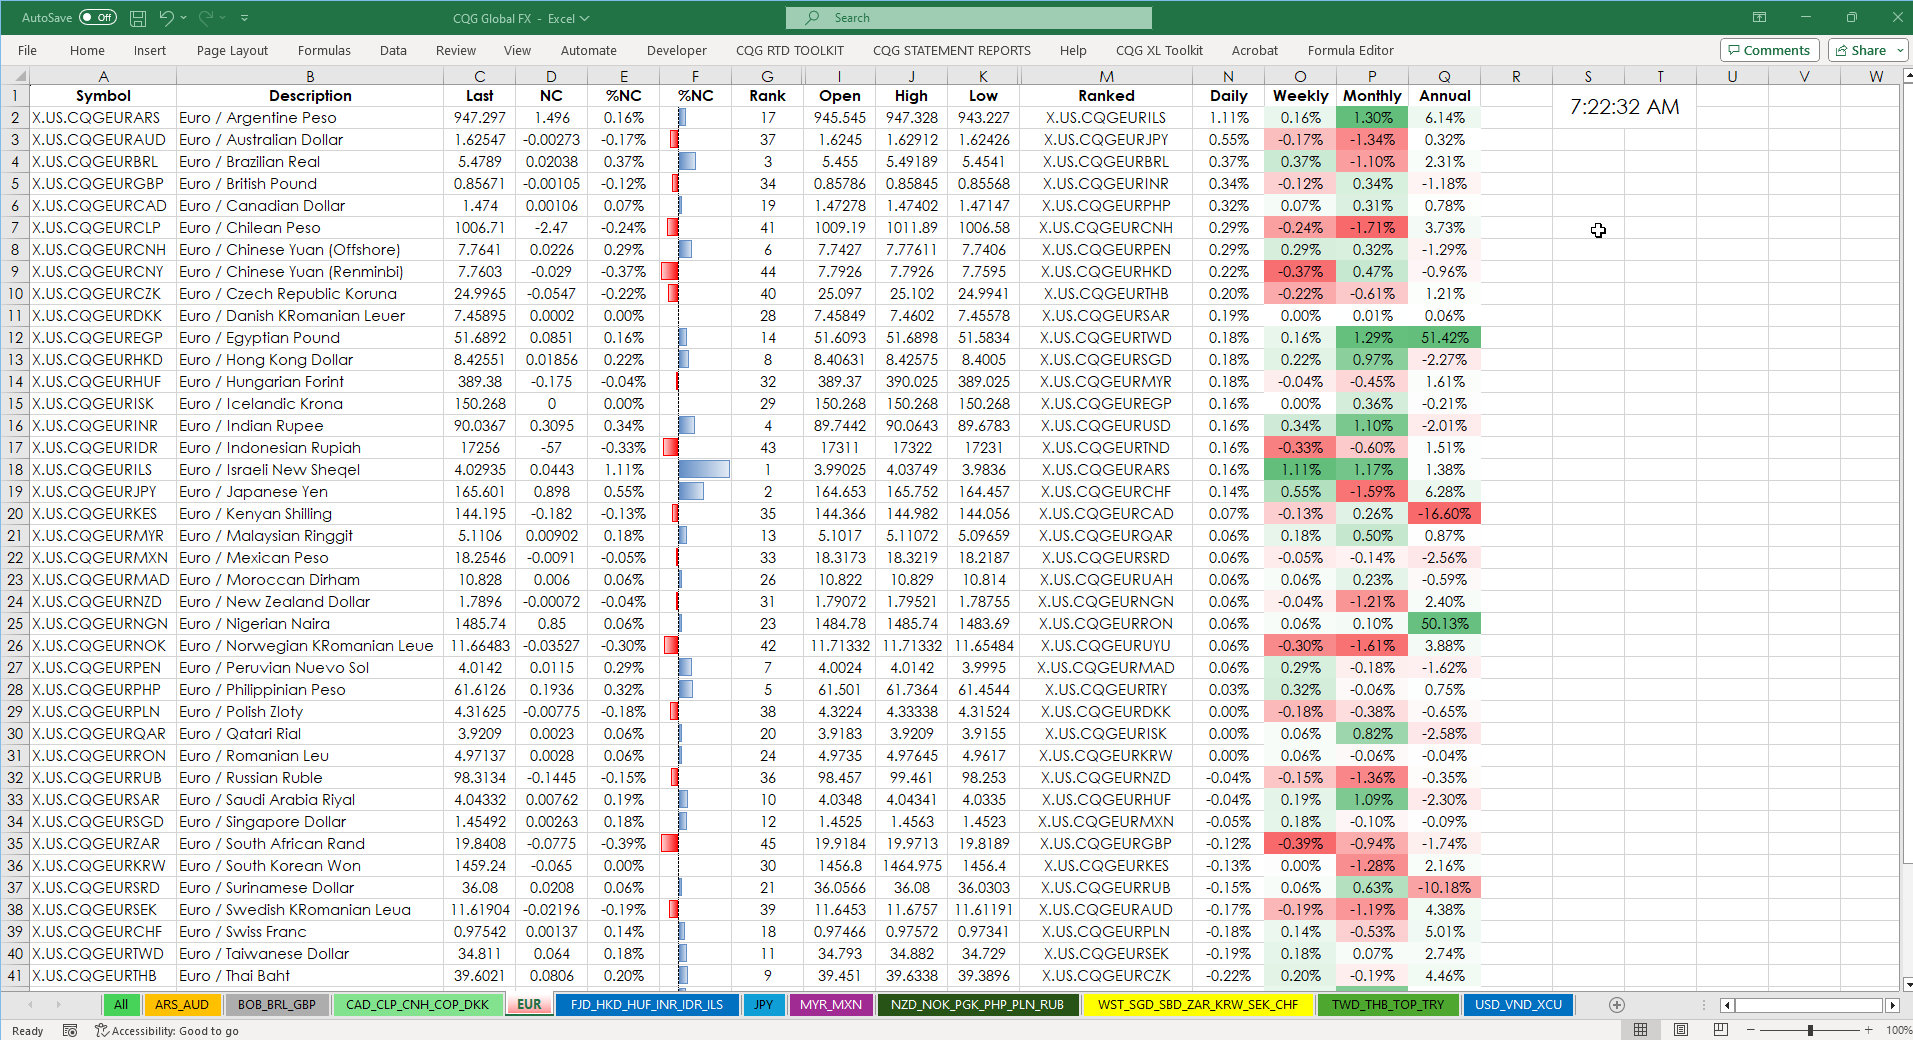
The tabs also group the markets by base pairs. An additional feature in the Excel spreadsheet is the pairs are ranked by today's percentage net change and the weekly, monthly, and annual percentage net change are heat-mapped.
Both the CQG Portfolio Monitor and the Excel spreadsheet are pulling a large amount of data. Customers are encouraged to remove unnecessary symbols to reduce the load.