This post presents "how to" rank and sort market data using Excel's SORTBY, CHOOSECOLS, and TAKE functions. This method is a replacement for applying RANK and VLOOKUP functions for ranking and sorting market data.
This post "Dynamic Ranking in Excel," detailed the steps to ranking net % change by using this modified version of the RANK function:
=RANK(B1,$B$1:$B$5,0)+COUNTIF($B$1:B1,B1)-1
The RANK function was modified to deal with ties. Including the COUNTIF functions adds 1 to any ties. For example, the basic RANK function could return values, such as:
1, 2, 3, 3, 4.
The ties are 3 and 3. Including COUNTIF will return values:
1, 2, 3, 4, 5.
And therefore, VLOOKUP returns the correct data.
=VLOOKUP(E1,$C$1:$D$5,2,FALSE)
The above steps require three columns:
- Rank function applied to the net % change column.
- Column with VLOOKUP Counter (1,2,3,4...)
- VLOOKUP sorts the ranked net % change column from 1to the final value.
All of the above can be calculated using Excel's SORTBY, CHOOSECOLS, and TAKE functions. These are from the Excel Dynamic Arrays family.
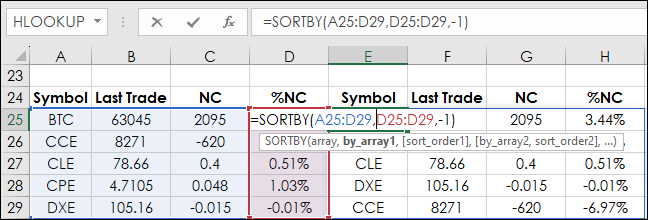
The first step is to sort the data by the % Net Change column. Cells A25 through D29 are the market data: Symbol, Last Trade, Net Change, and % Net Change. Cell D25 uses the SORTBY function:
=SORTBY(A25:D29,D25:D29,-1)
The above formula, entered in cell E25, is sorting the array A25:D28 by column D25:D29 in a descending order (-1). The function returns all four columns by "Spilling" into cells E25:J29.
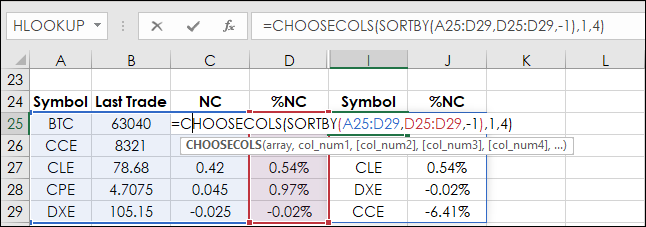
However, the data required is just the sorted symbols by the % net change. Use the function CHOOSECOL, here columns 1 and 4, to modify the returned data.
=CHOOSECOLS(SORTBY(A25:D29,D25:D29,-1),1,4)
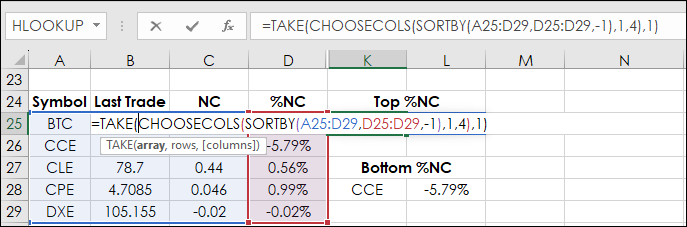
 Perhaps, the important data is simply the top and bottom % net change. The data can be filtered by the TAKE function.
=TAKE(CHOOSECOLS(SORTBY(A25:D29,D25:D29,-1),1,4),1)
The above function has -1 (descending) for the SORTBY function.
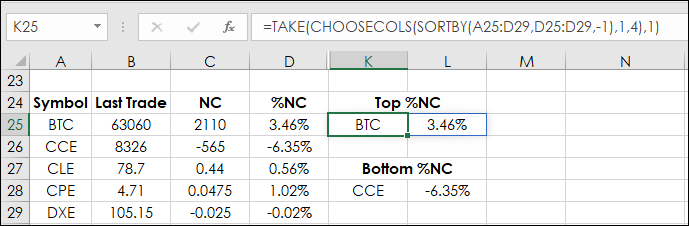
=TAKE(CHOOSECOLS(SORTBY(A25:D29,D25:D29,1),1,4),1)
The above function has 1 (ascending) for the SORTBY function.
The results of the two TAKE functions are displayed.
The downloadable Excel sample has two sections: Commodities and the top 20 stocks in the NASDAQ 100 ETF (Symbol: QQQ).
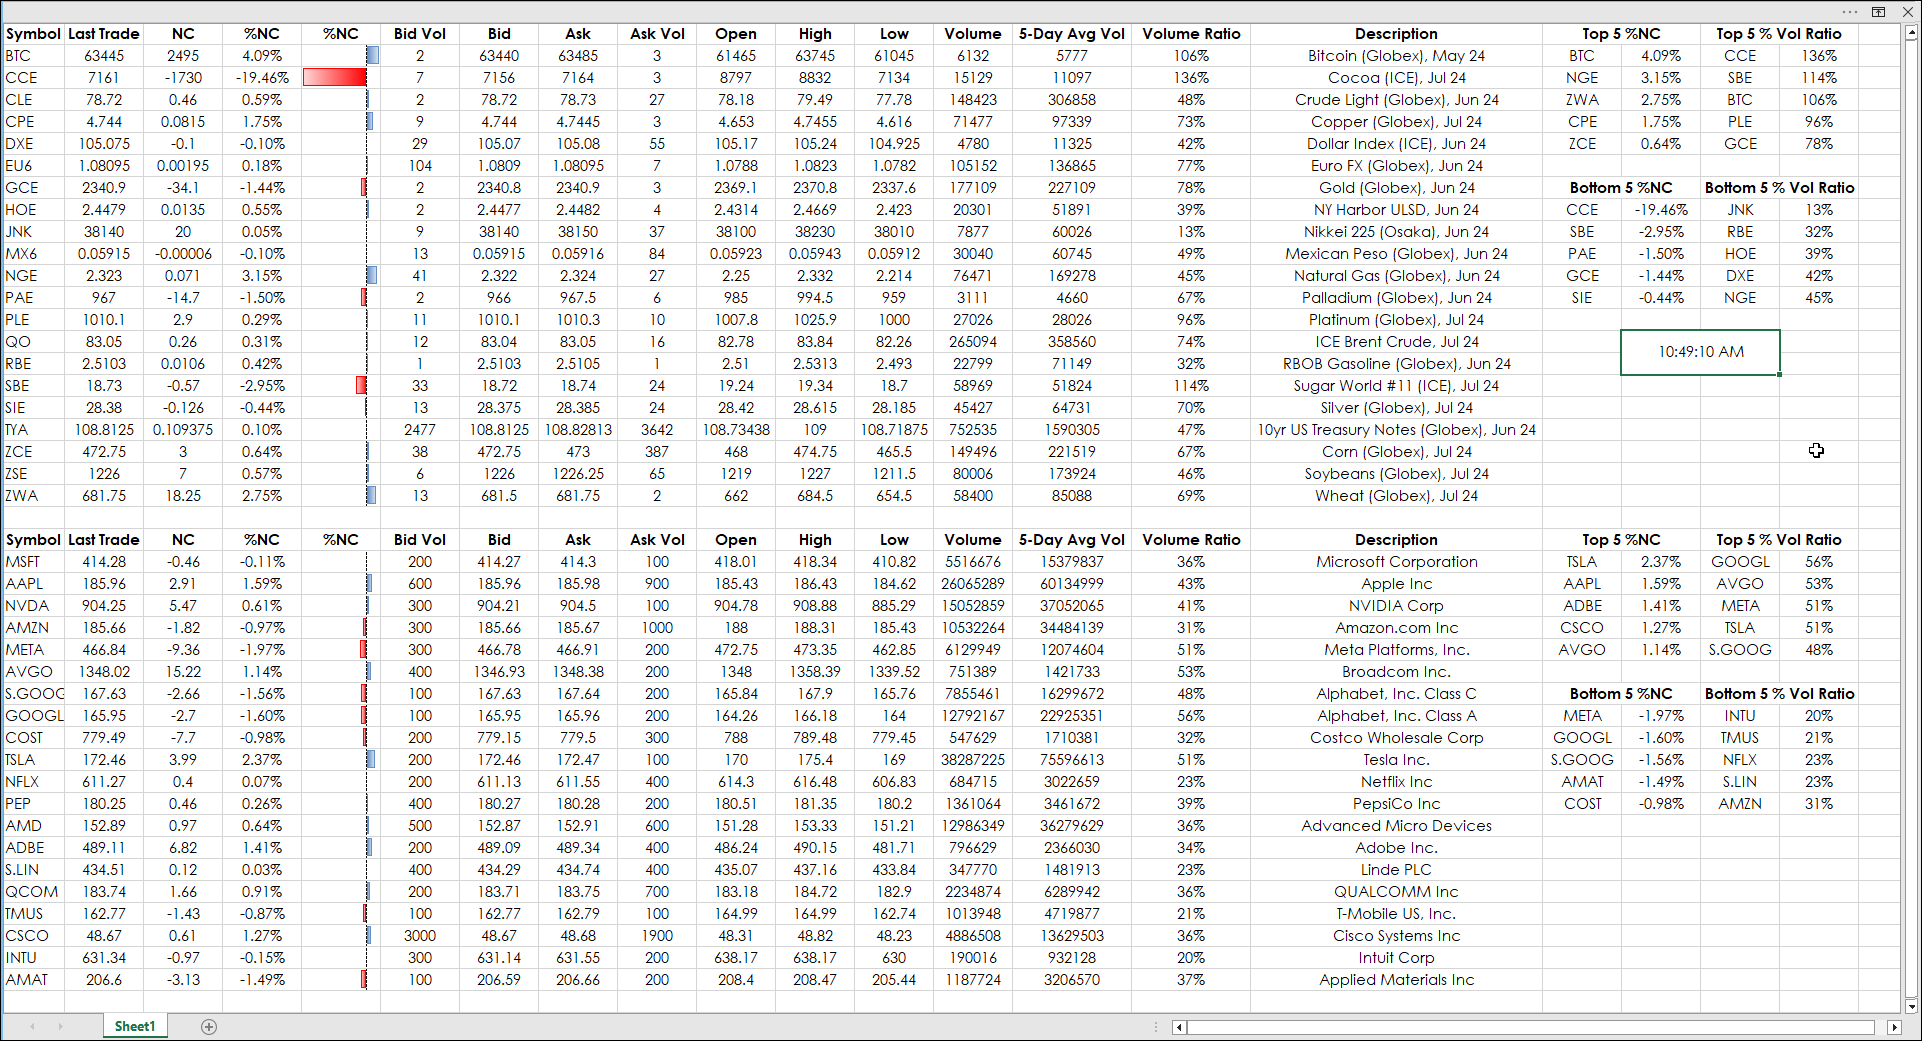
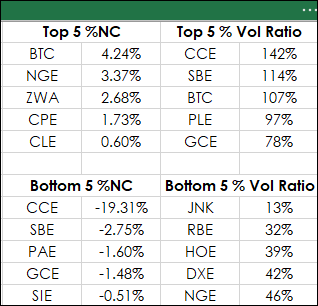
The right-hand display presents the top and bottom 5 by % net change. In addition, in the main body of the dashboard three columns display today's volume, the previous 5-day moving average of the volume, and the ratio.
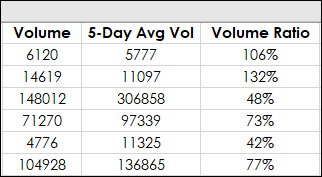
Readings over 100% may indicate unusual activity. The top 5 % Volume Ratios and the bottom 5 % Volume Ratios are calculated using Excel's SORTBY, CHOOSECOLS, and TAKE functions.
When using these functions they Spill into the cells. If there is anything in the cells then the Spill Error will be displayed. This post was inspired by a post by Leila Gharani.
The Excel spreadsheet is pulling a large amount of data. Customers are encouraged to remove unnecessary symbols to reduce the load.
Requirements: CQG Integrated Client or QTrader, and Excel 365 (locally installed, not in the Cloud) or more recent.