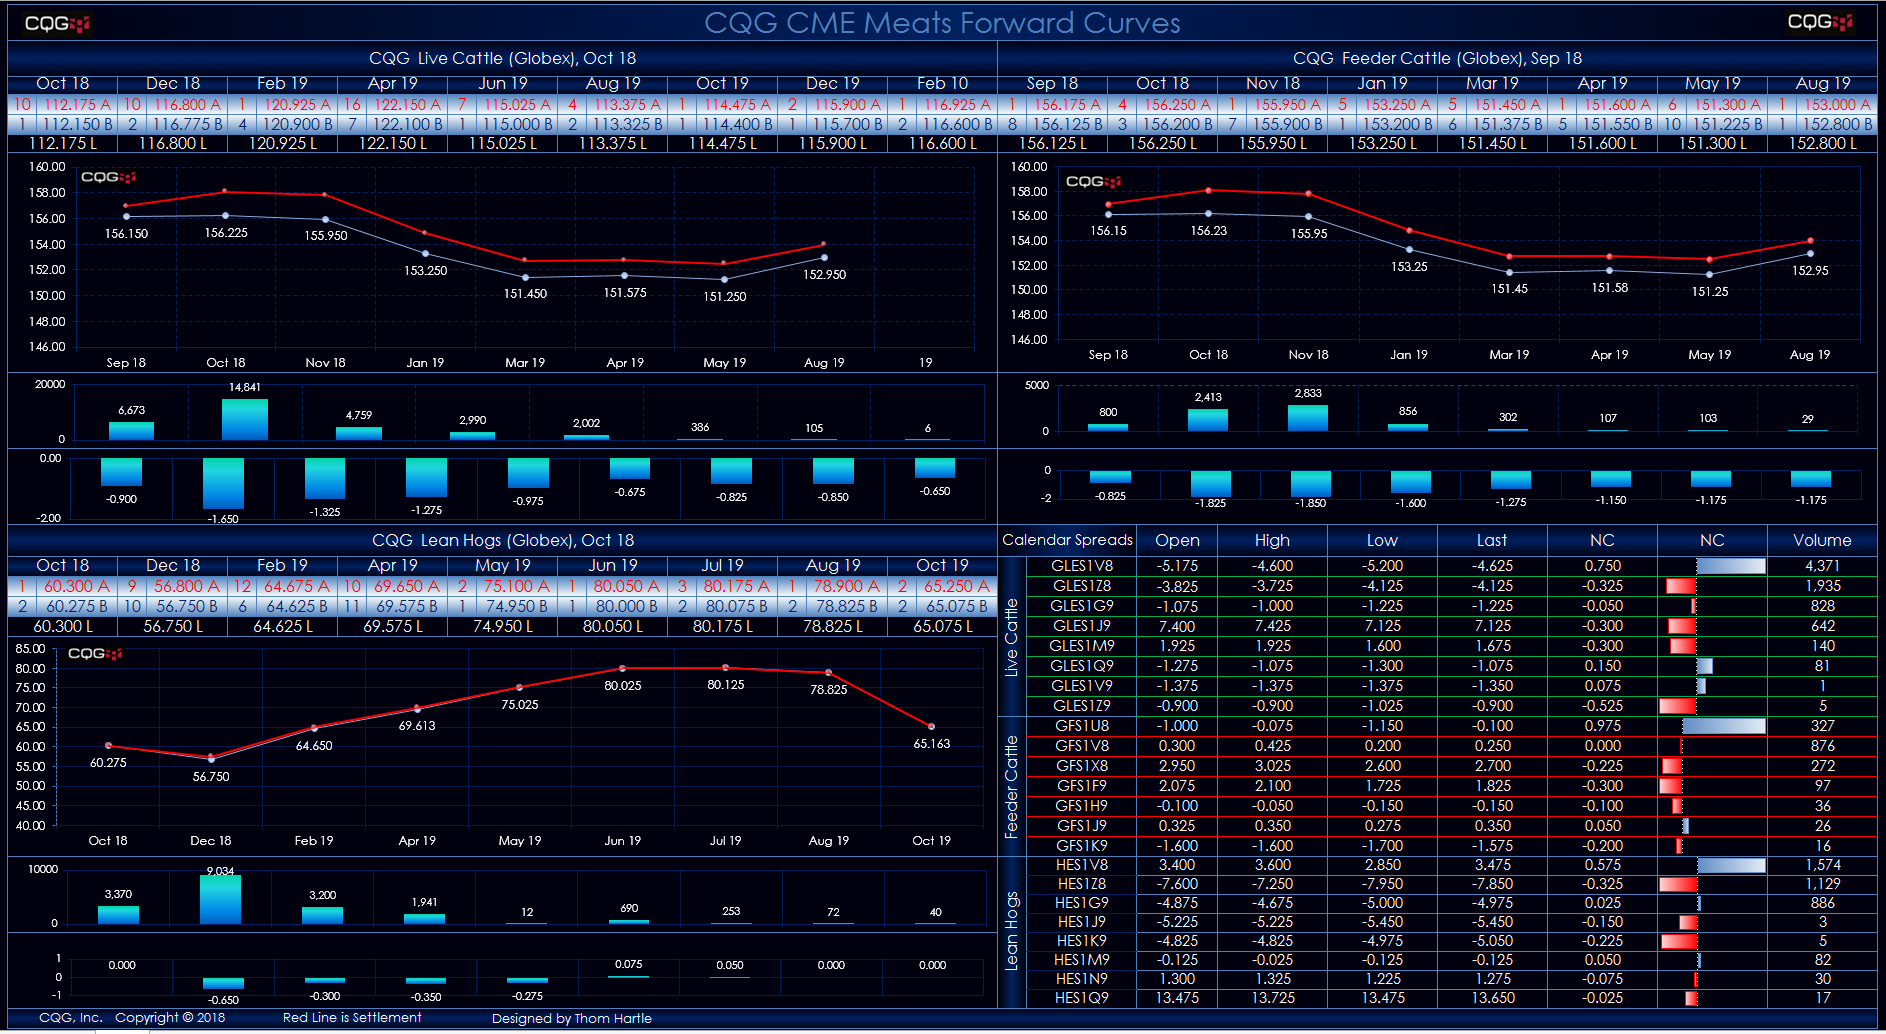
This Microsoft Excel® spreadsheet pulls in live cattle, feeder cattle, and lean hogs market data traded on CME Globex.
The forward curves display today's data. If the last price is… more
This Microsoft Excel® spreadsheet pulls in live cattle, feeder cattle, and lean hogs market data traded on CME Globex.
The forward curves display today's data. If the last price is… more
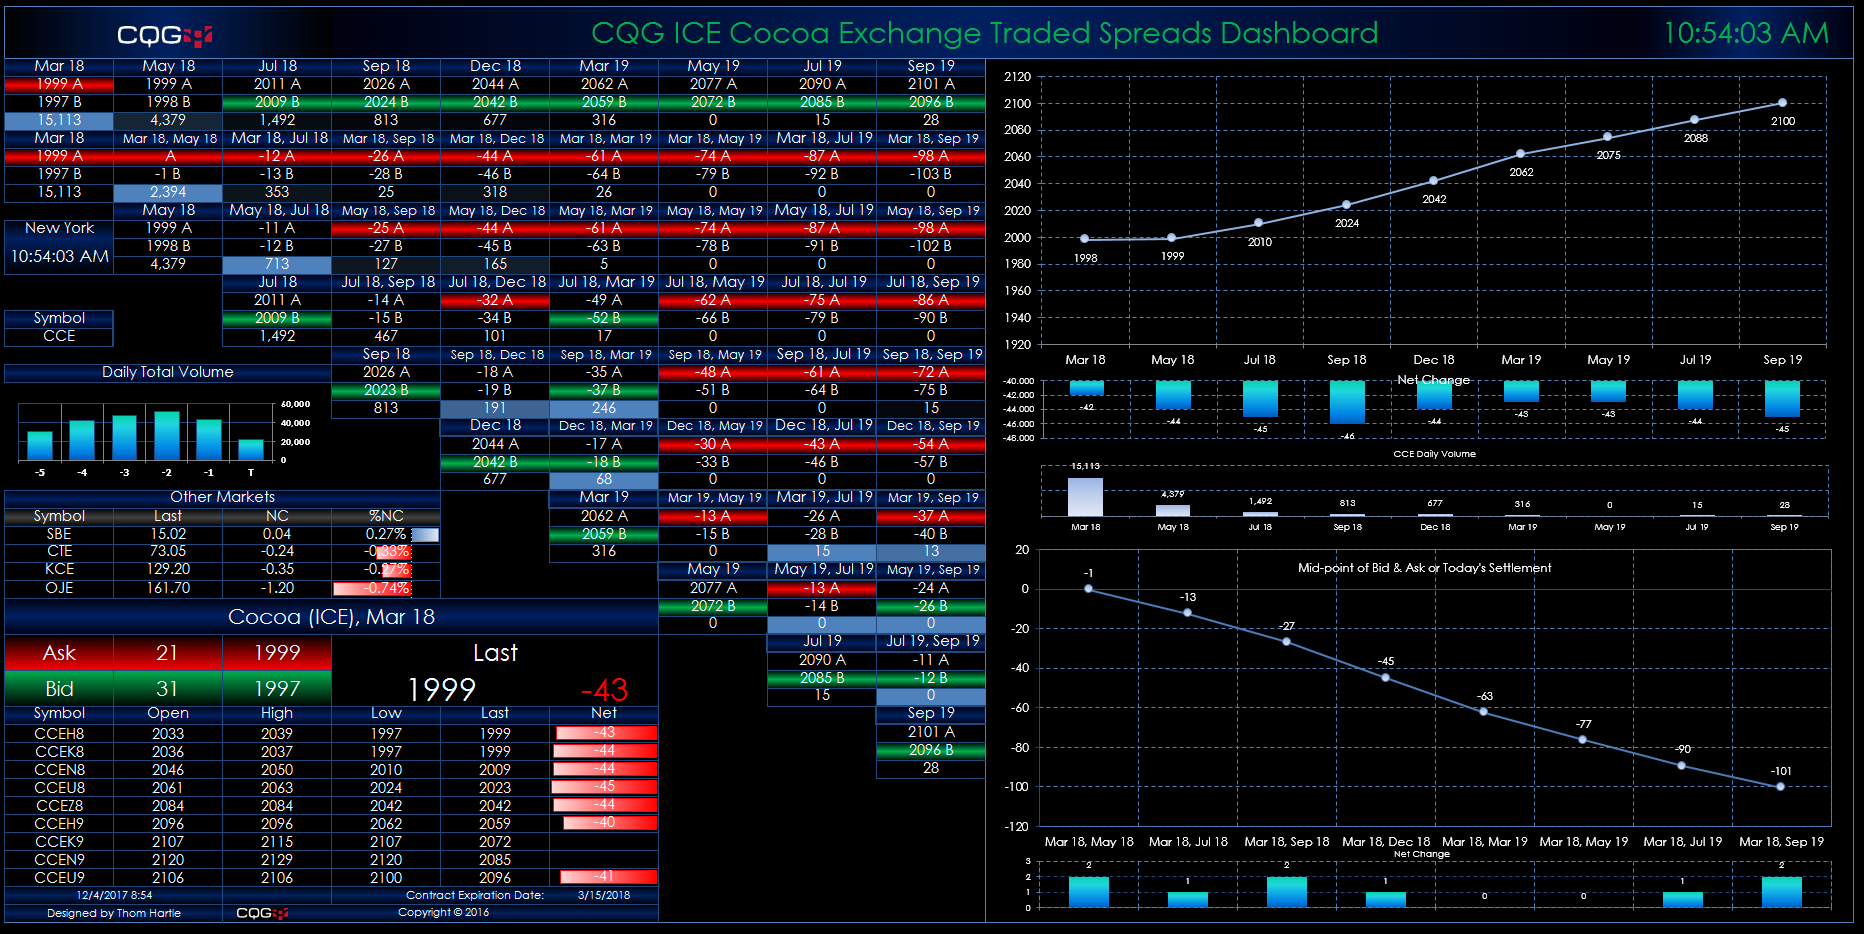
This Microsoft Excel® dashboard displays market data for cocoa spreads traded on the ICE platform using a matrix-style format. The outrights are along the top row and at the start of each row. The… more
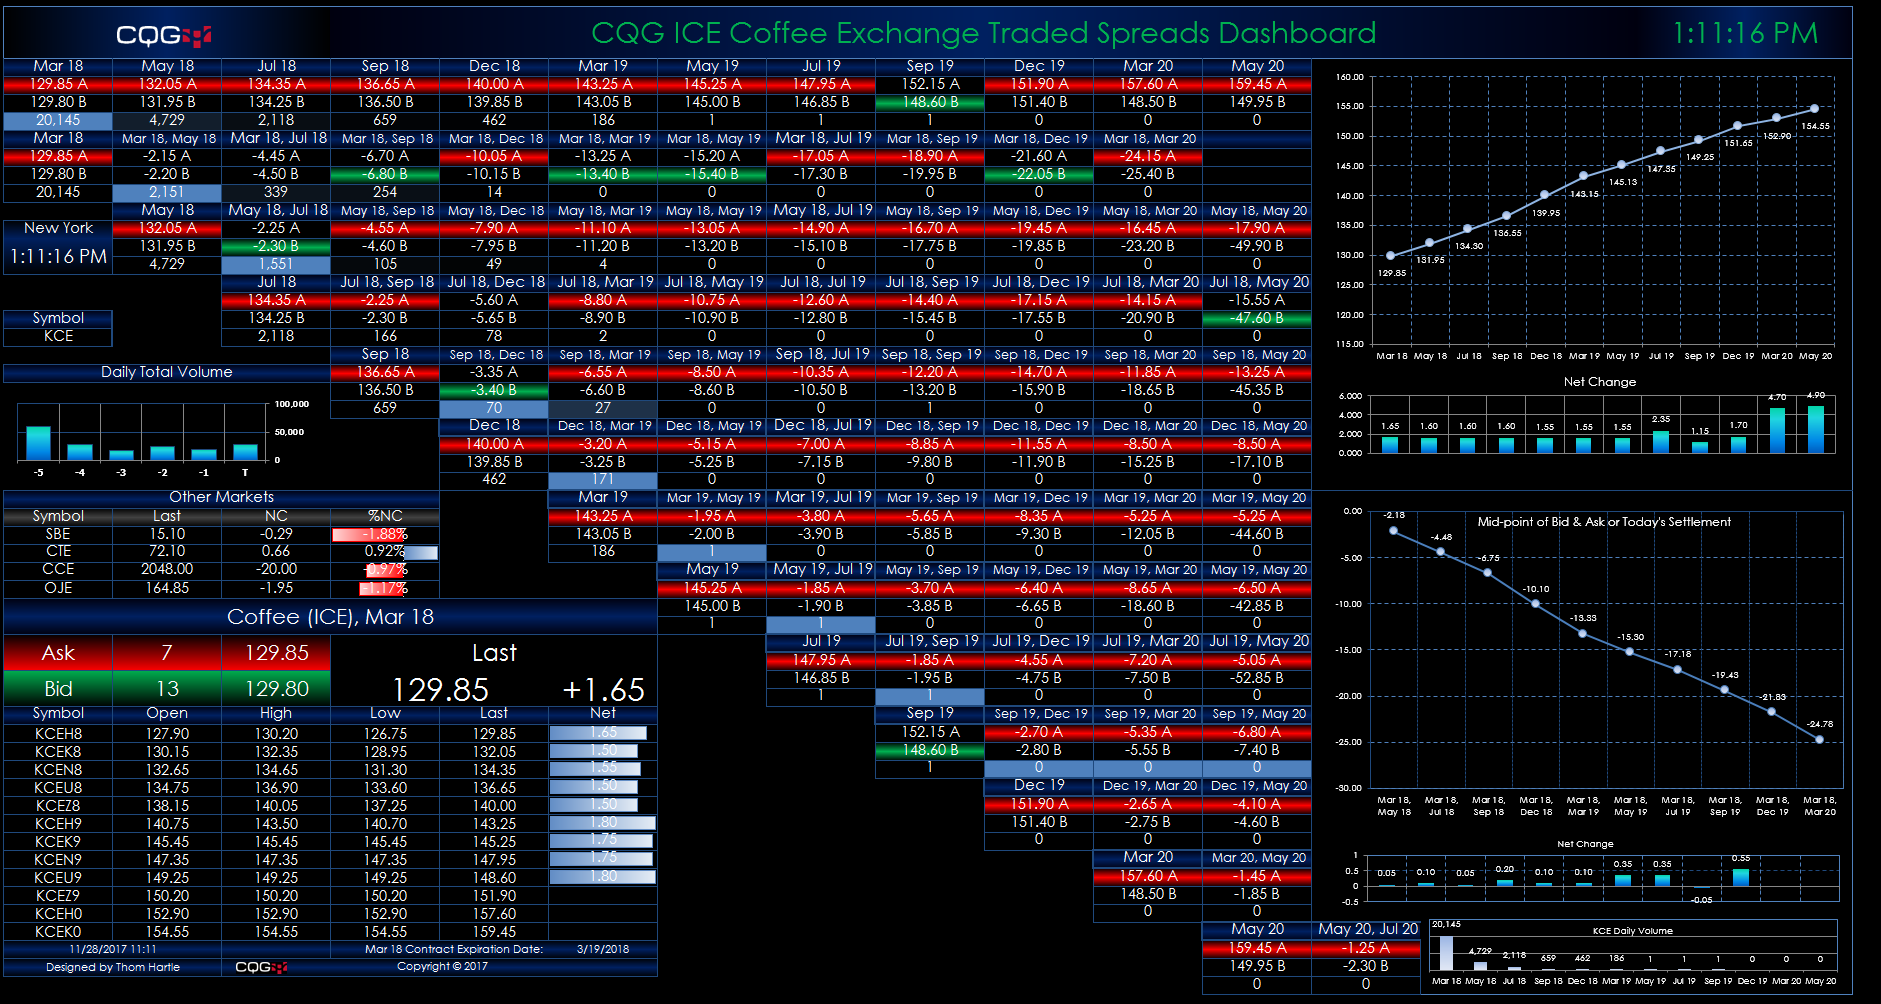
This Microsoft Excel® dashboard displays market data for coffee spreads traded on the ICE platform using a matrix-style format. The outrights are along the top row and at the start of each row.… more
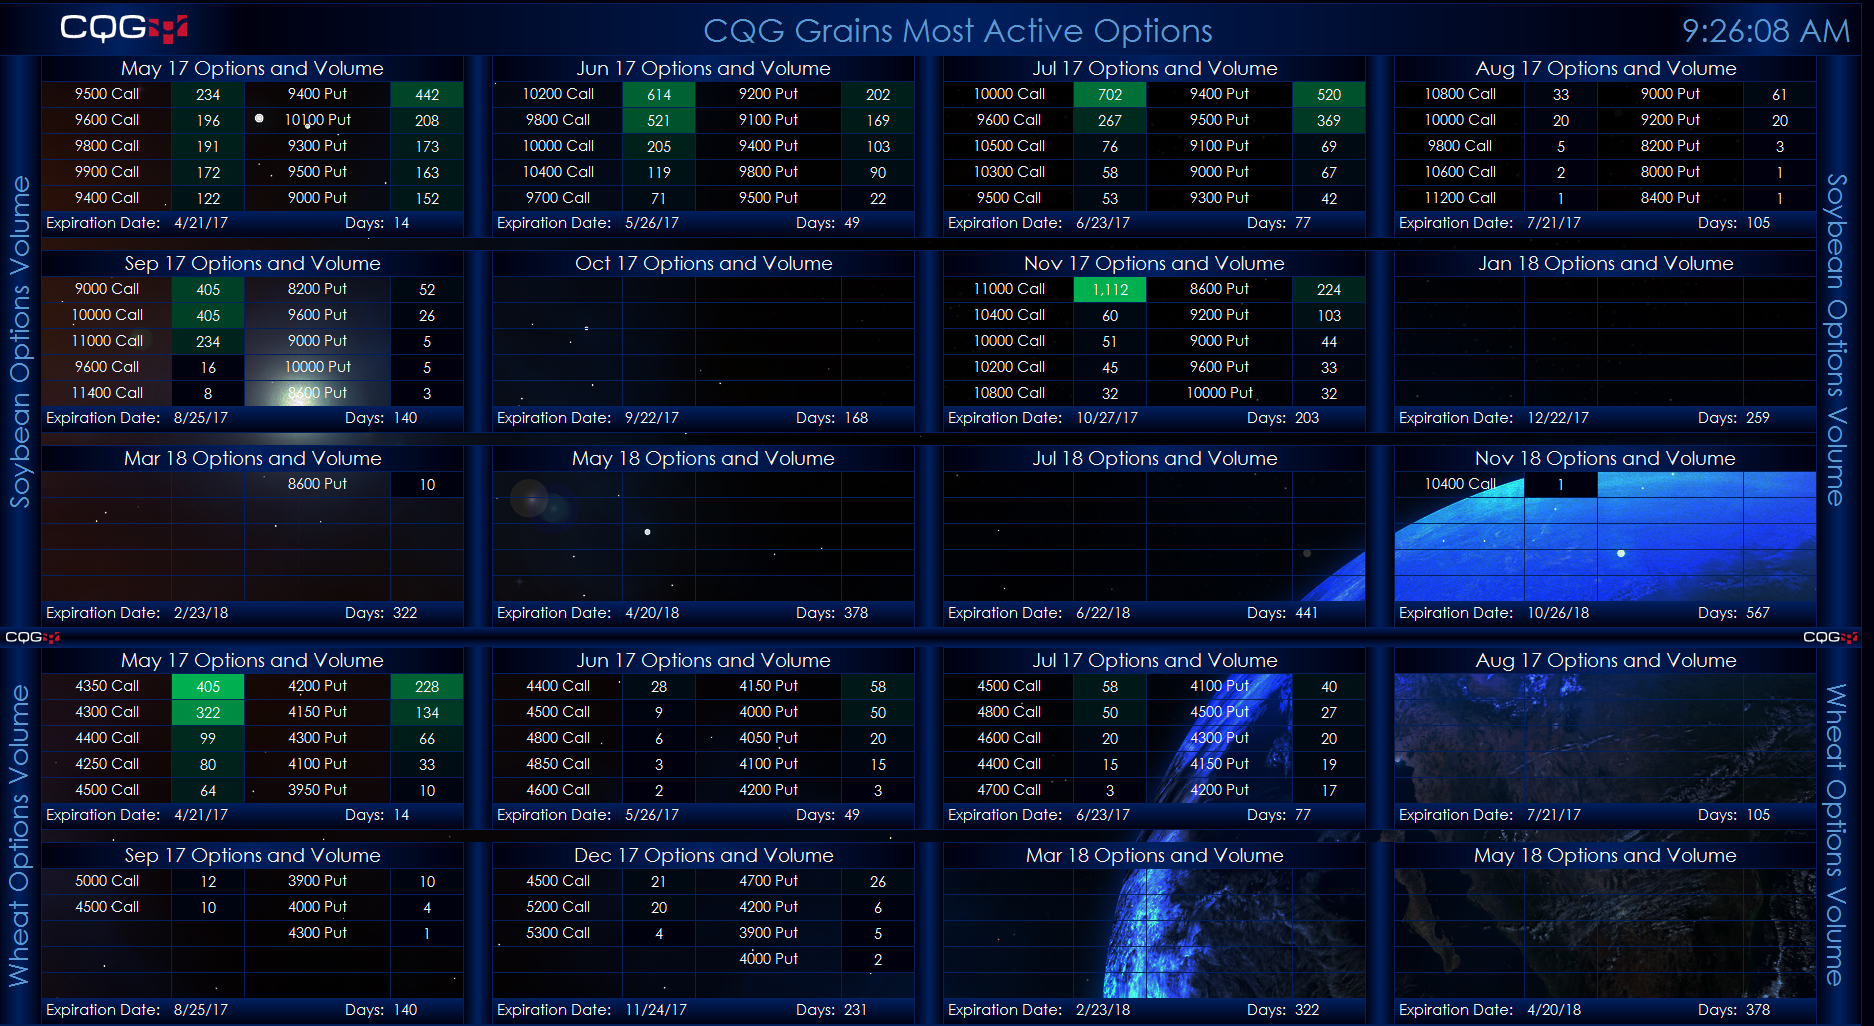
This Microsoft Excel® dashboard scans the options on soybeans, wheat, and corn (Globex) futures markets for volume. It displays strikes ranked by the volume traded for each expiry listed… more
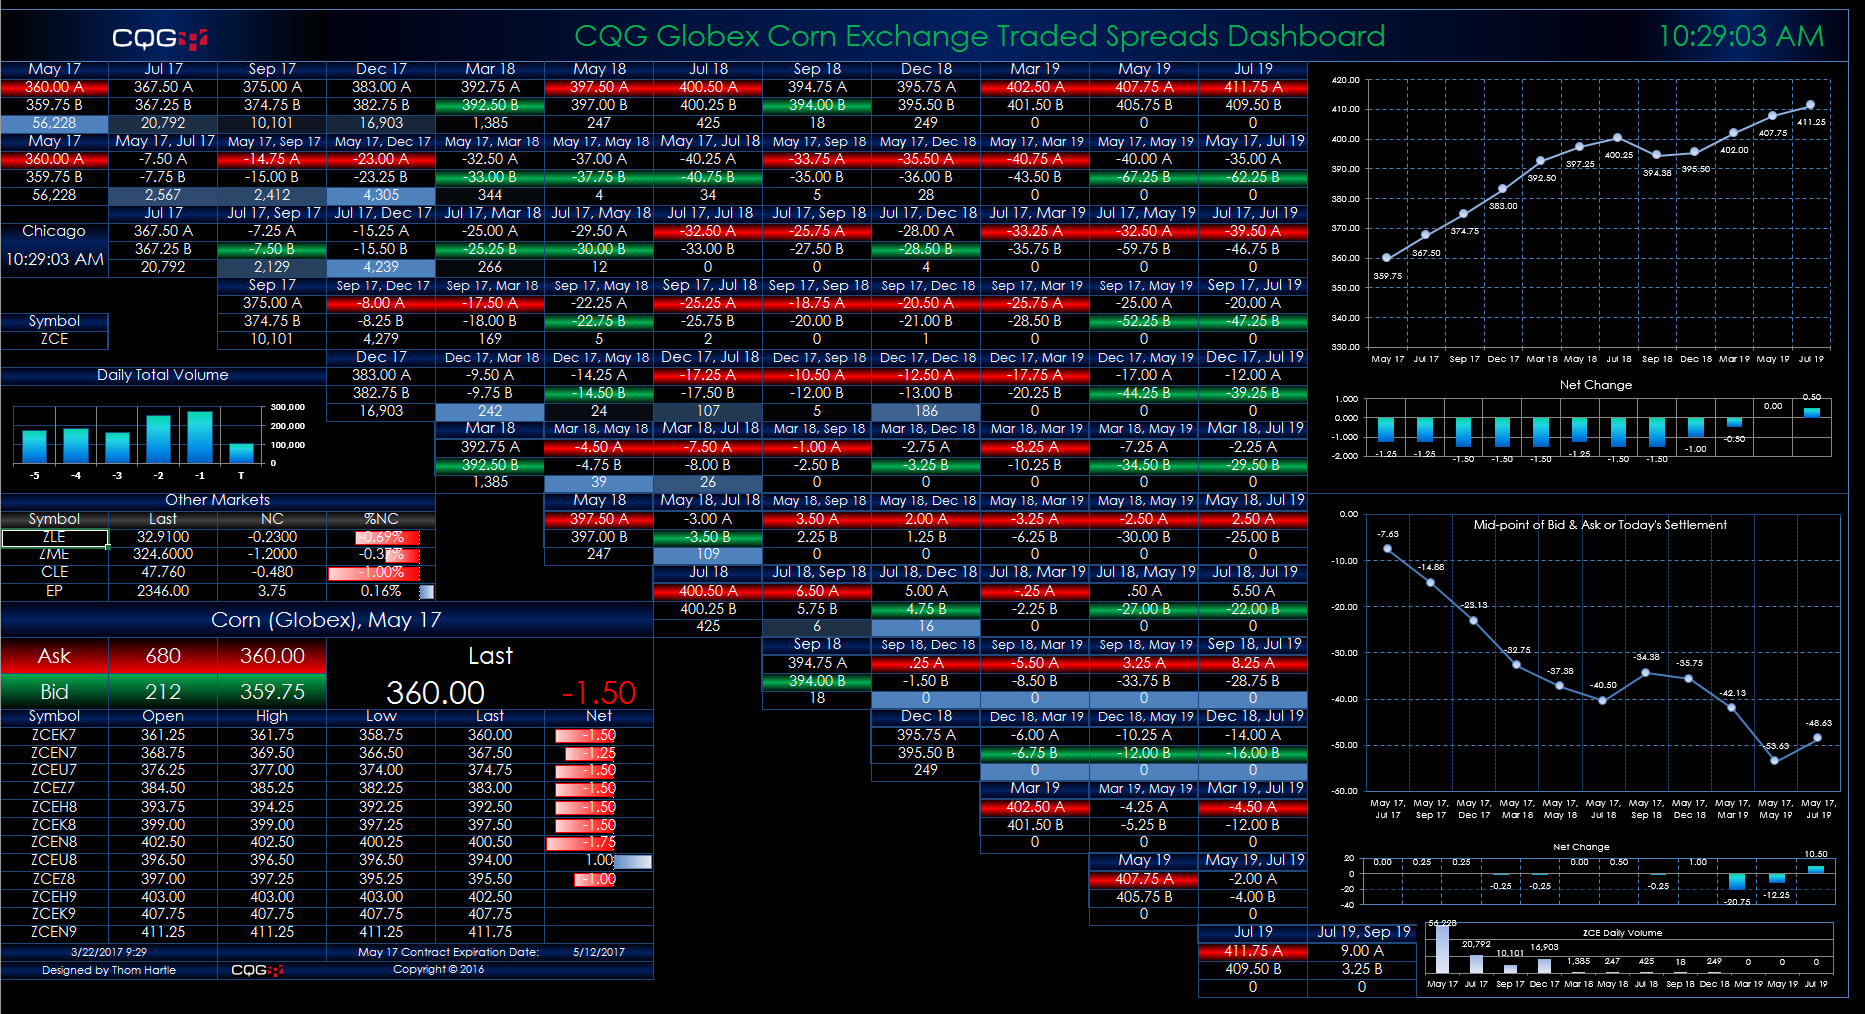
This Microsoft Excel® dashboard displays market data for grain spreads traded on the Globex platform using a matrix-style format. The outrights are along the top row and the start of each row. The… more
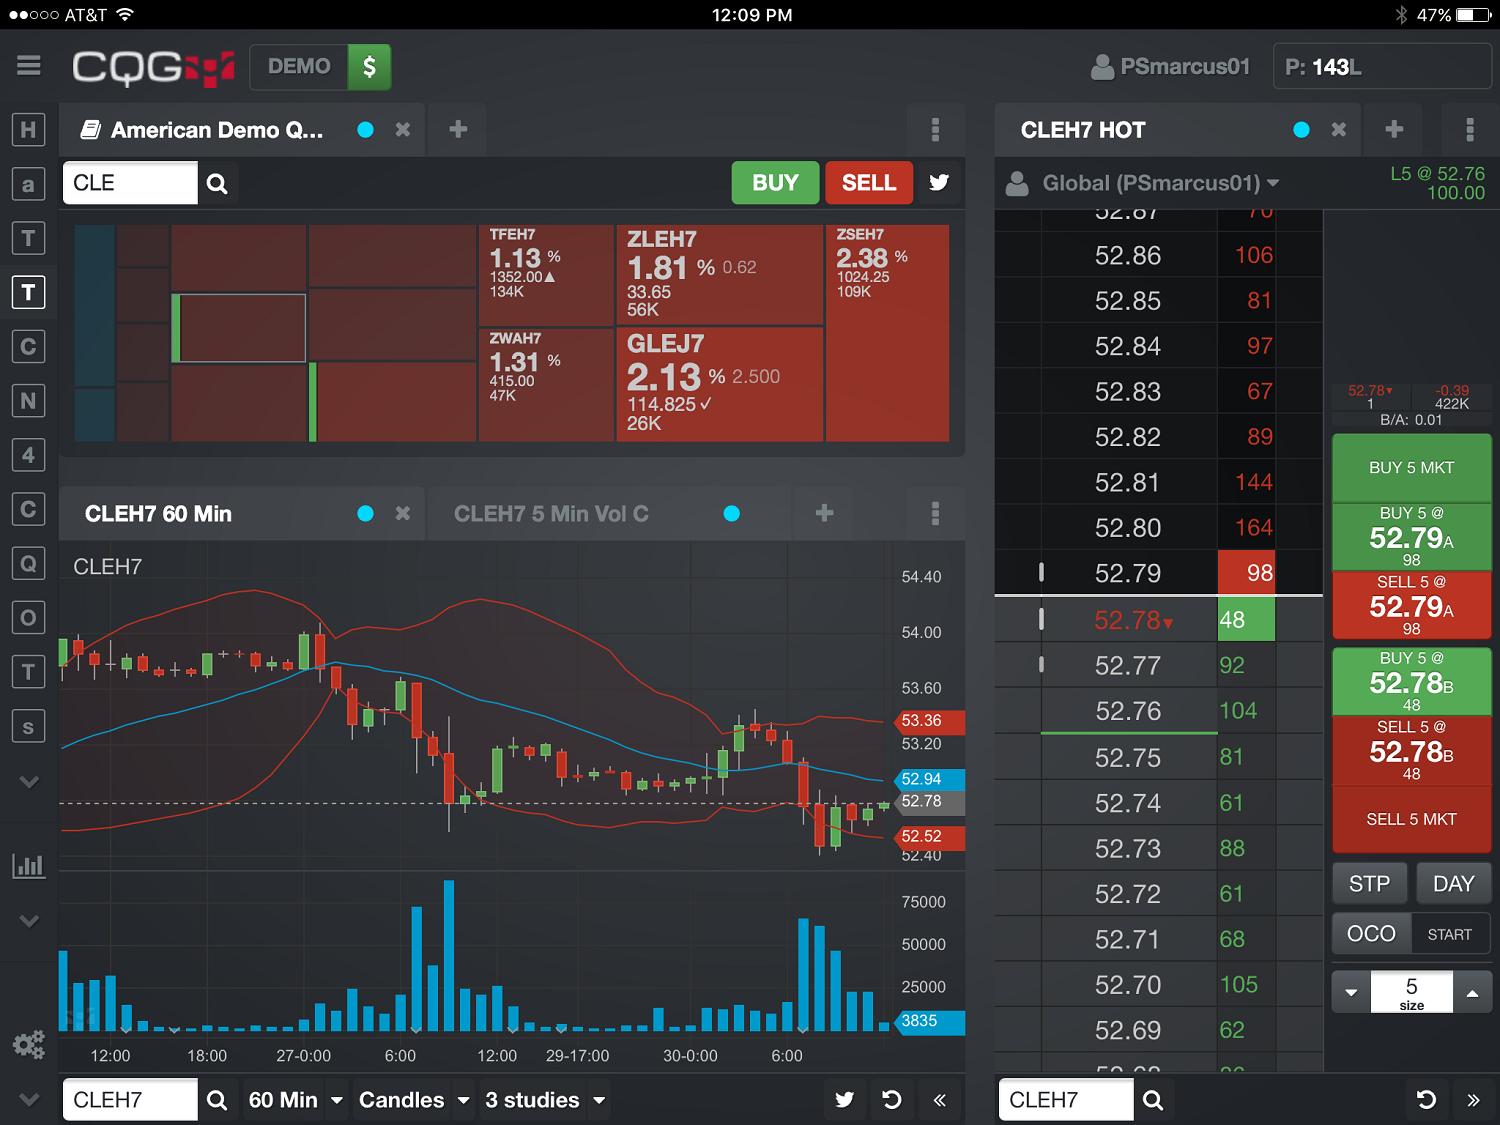
This CQG M dashboard layout displays a portfolio of symbols from the Americas (available with a subscription to the CME Globex feed on CQG) in a heat-map style. Tapping on a quote pushes the… more
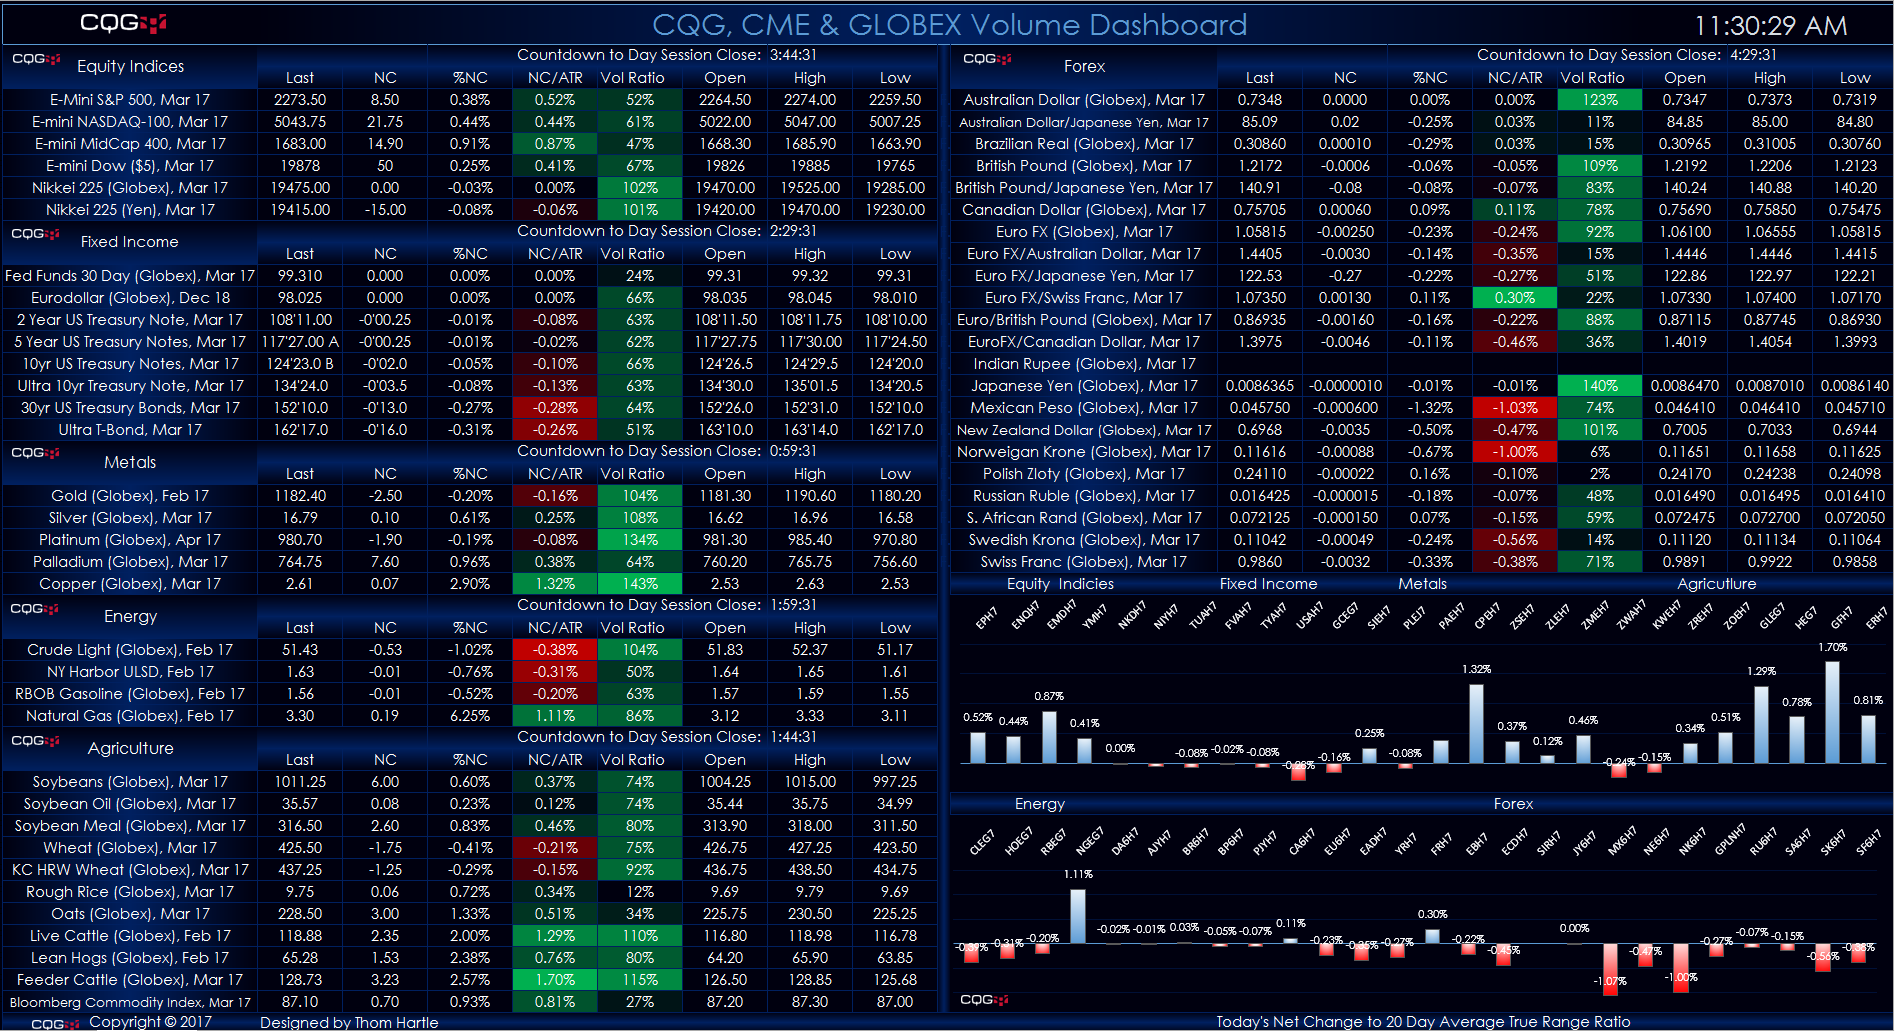
This Microsoft Excel® dashboard displays key market information for contracts traded on the CME Exchange and the Globex platform. The markets are grouped by these products:
Equity Indices… more
This Microsoft Excel® dashboard displays market data for Soybean Crush Spreads traded on the CME Globex platform. These spreads have an added layer of complexity due to the soybean contract not… more

These Microsoft Excel® spreadsheets determine the at-the-money option and display a table of thirty strikes above and below the at-the-money. The tables consist of market data and the implied… more
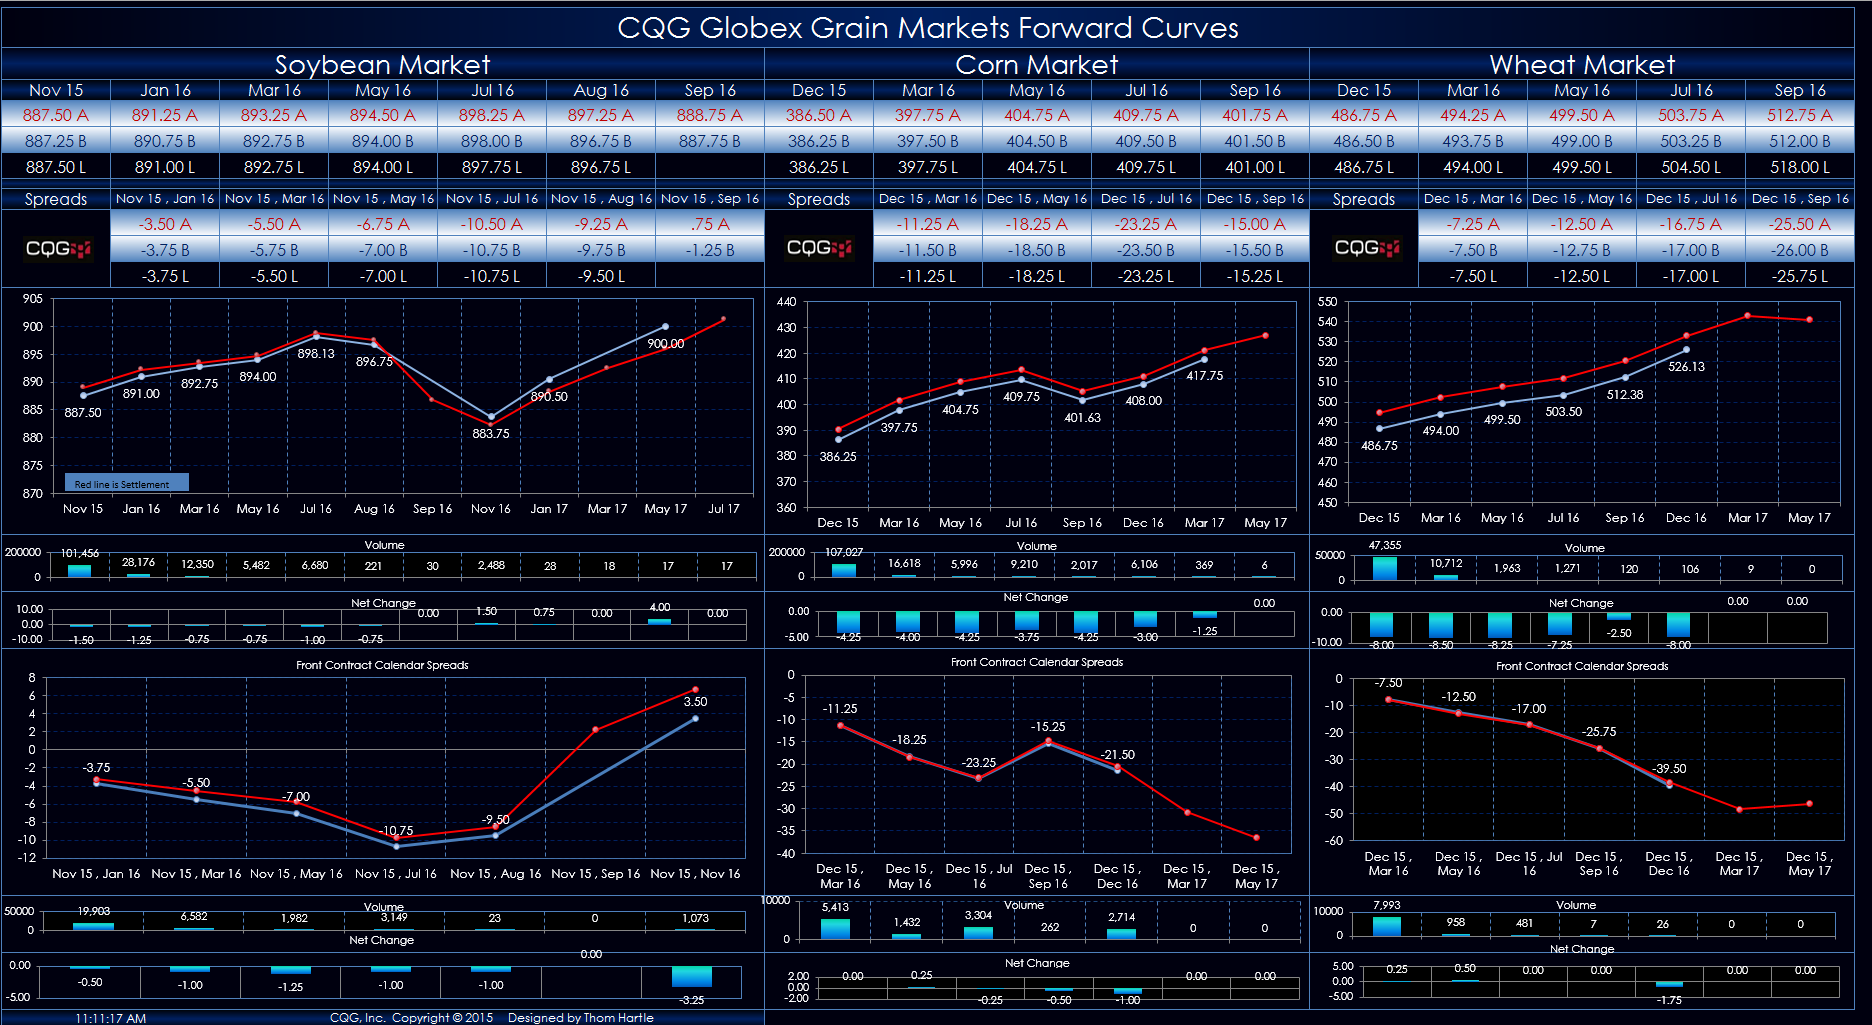
This Microsoft Excel® spreadsheet uses the CQG Toolkit to pull in market data for CME Globex-traded soybeans, corn, and wheat.
The forward curves display today's data. If the last price is… more