
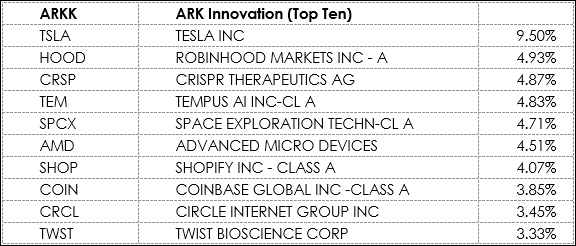
On Workspaces there are four Excel Dashboard for tracking the current session’s performance of four ARK ETFs. The four ETFs added the recent SpaceX IPO: Space Exploration Technologies Corp. Class… more
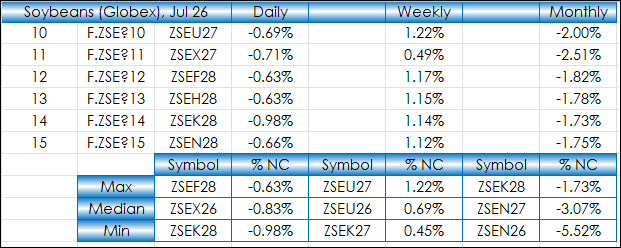
This post walks through using Excel's XLOOKUP with Min, Median, and Max Functions to create a summary table of market performance for the forward curves of Soybeans, Soybean Meal, Soybean Oil,… more

This midweek look shows the Nikkei 225 (Osaka), Sep 26 contract, with a gain of +6.90%. The best performer in the US market is the E-mini Dow, Sep 26 contract showing a gain of +1.78%. The… more

Midweek, the OSE 10 Year JGB, Sep 26 contract is up +0.26%. The best performer in the US market is the 30yr US Treasury Bond (Globex), Sep 26 contract, which is higher by +0.42%. The best… more

Each Wednesday this article will be updated with the current seasonal study using CQG's Seasonal analysis applied to the Soybean, Wheat and Corn markets. You can download the CQG pac providing the… more
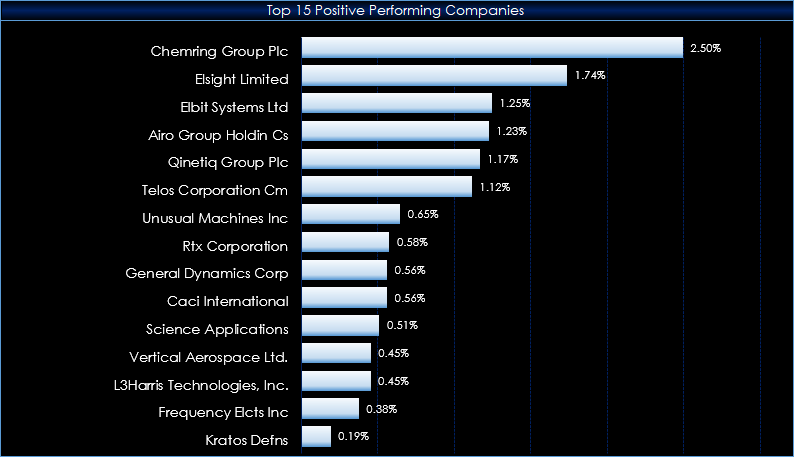
This Excel Dashboard tracks the holdings of the Defiance Drone & Modern Warfare ETF.
From their Web Site:
Modern defense is being reshaped by drones, autonomous systems, and AI-… more
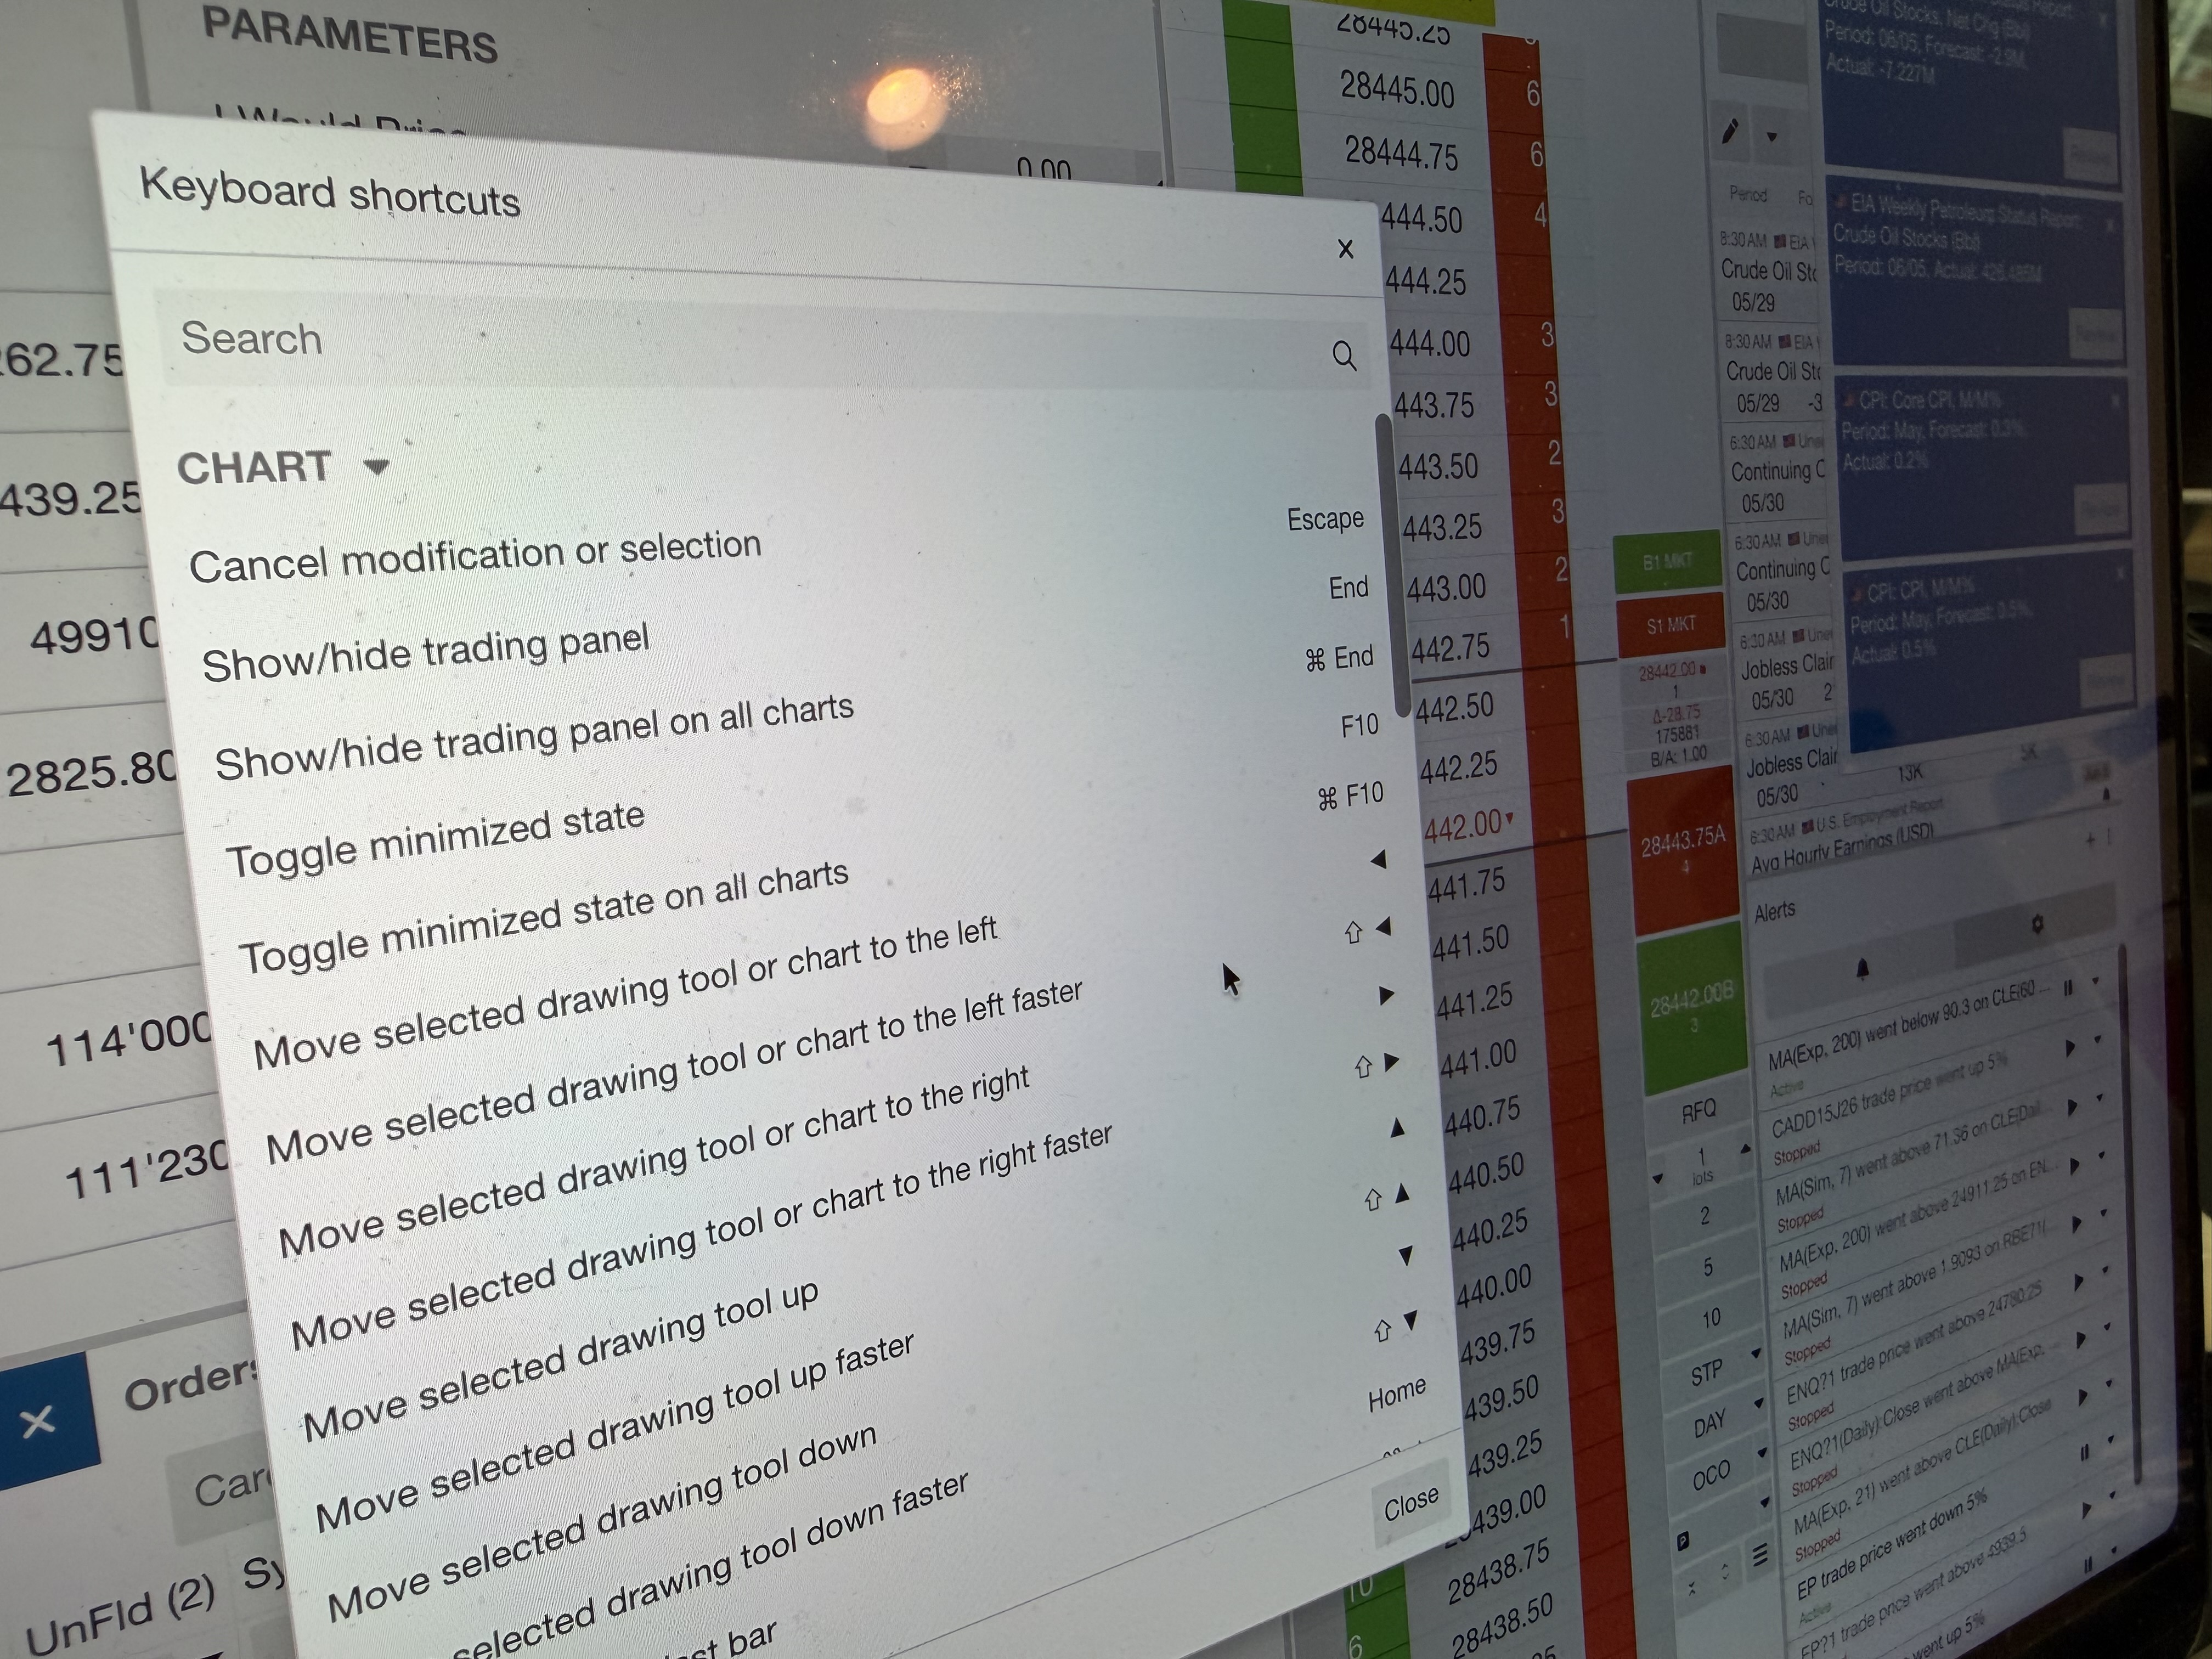
Various improvements and bug fixes.
General/ChartingAdded available keyboard shortcuts to help menu, added more kb shortcuts for chartingTrading/OptionsAdded delta column to Spreadsheet Trader… more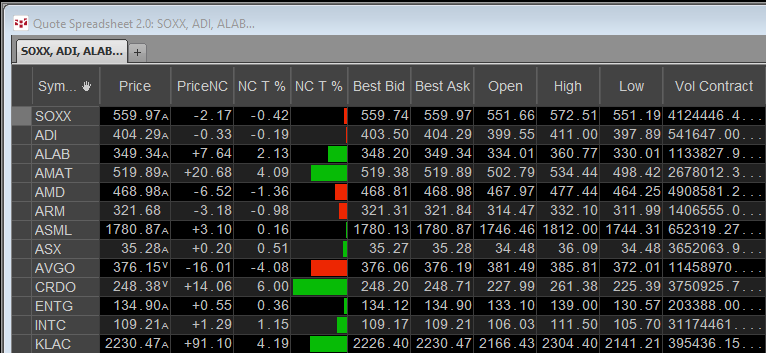
From their website:
The iShares Semiconductor ETF seeks to track an U.S. equity index of companies in the semiconductor sector. The fund offers a way to invest in companies across the… more
This midweek look shows the Nikkei 225 (Osaka), Jun 26 contract, with a loss of -4.72%. The best performer in the US market is the E-mini Midcap, Jun 26 contract showing a gain of -0.23%.… more
Midweek, the OSE 10 Year JGB, Jun 26 contract is down by -0.26%. The best performer in the US market is the 5yr US Treasury Note (Globex), Jun 26 contract, which is higher by +0.09%. The… more