
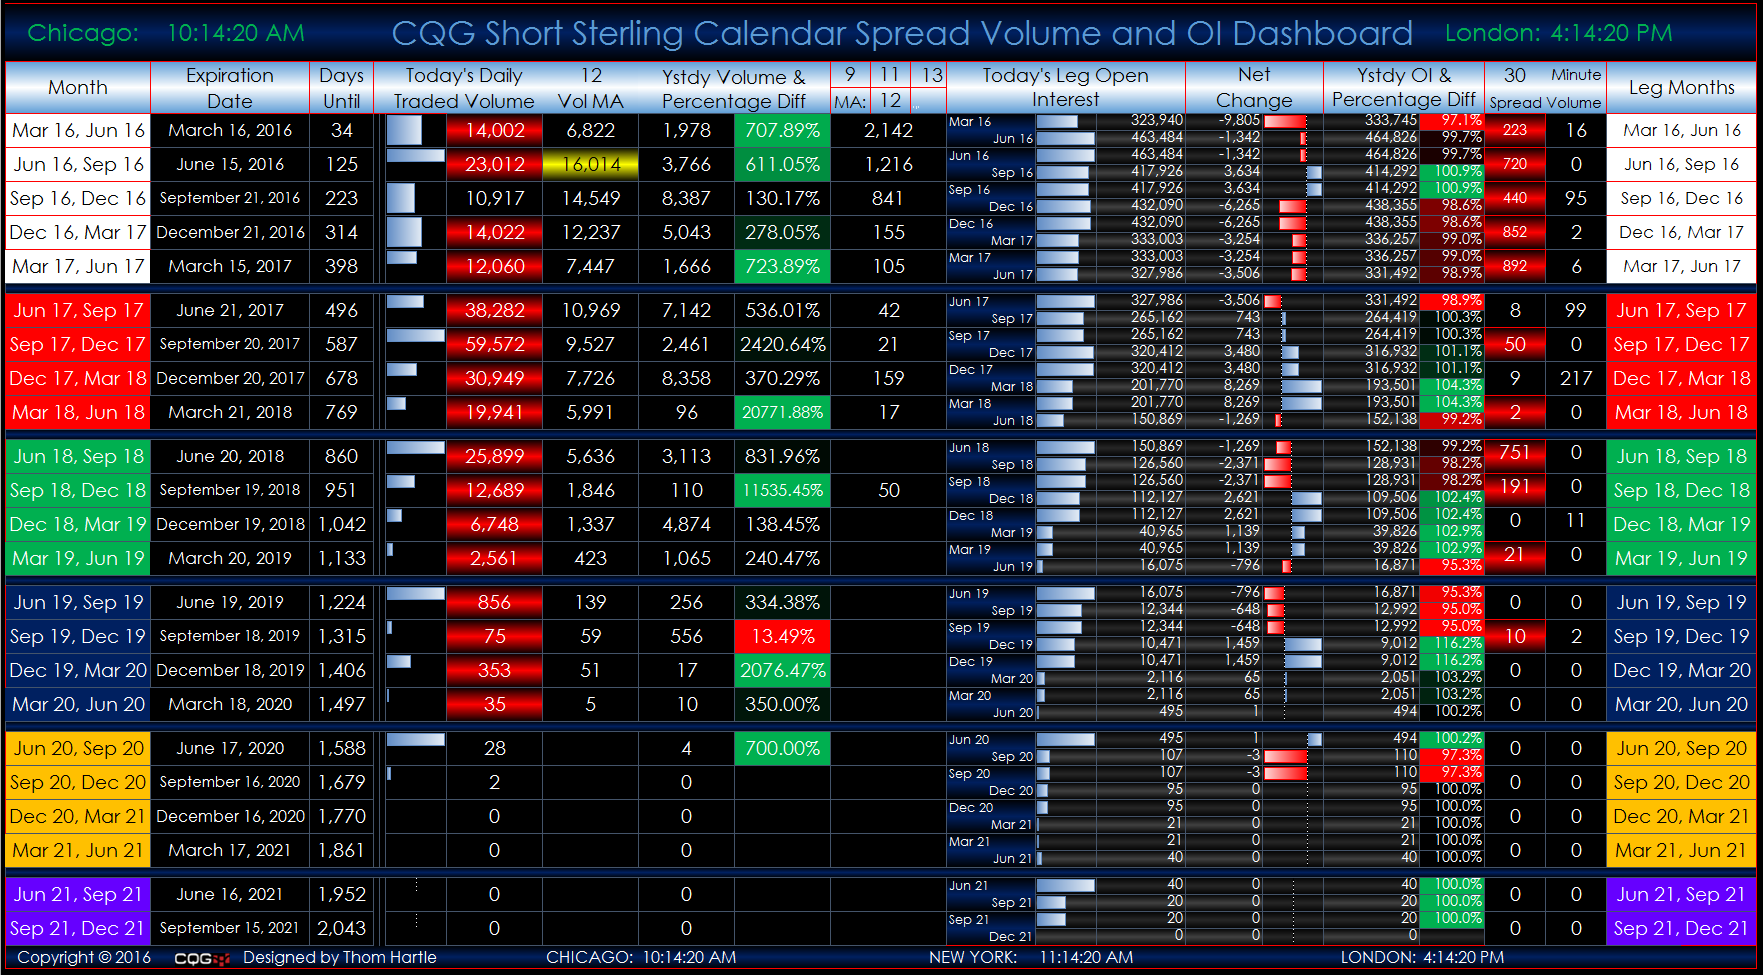
This Microsoft Excel® dashboard displays individual Short Sterling three-month calendar spreads and their individual legs for tracking the rolls. All of the active deliveries for each individual… more
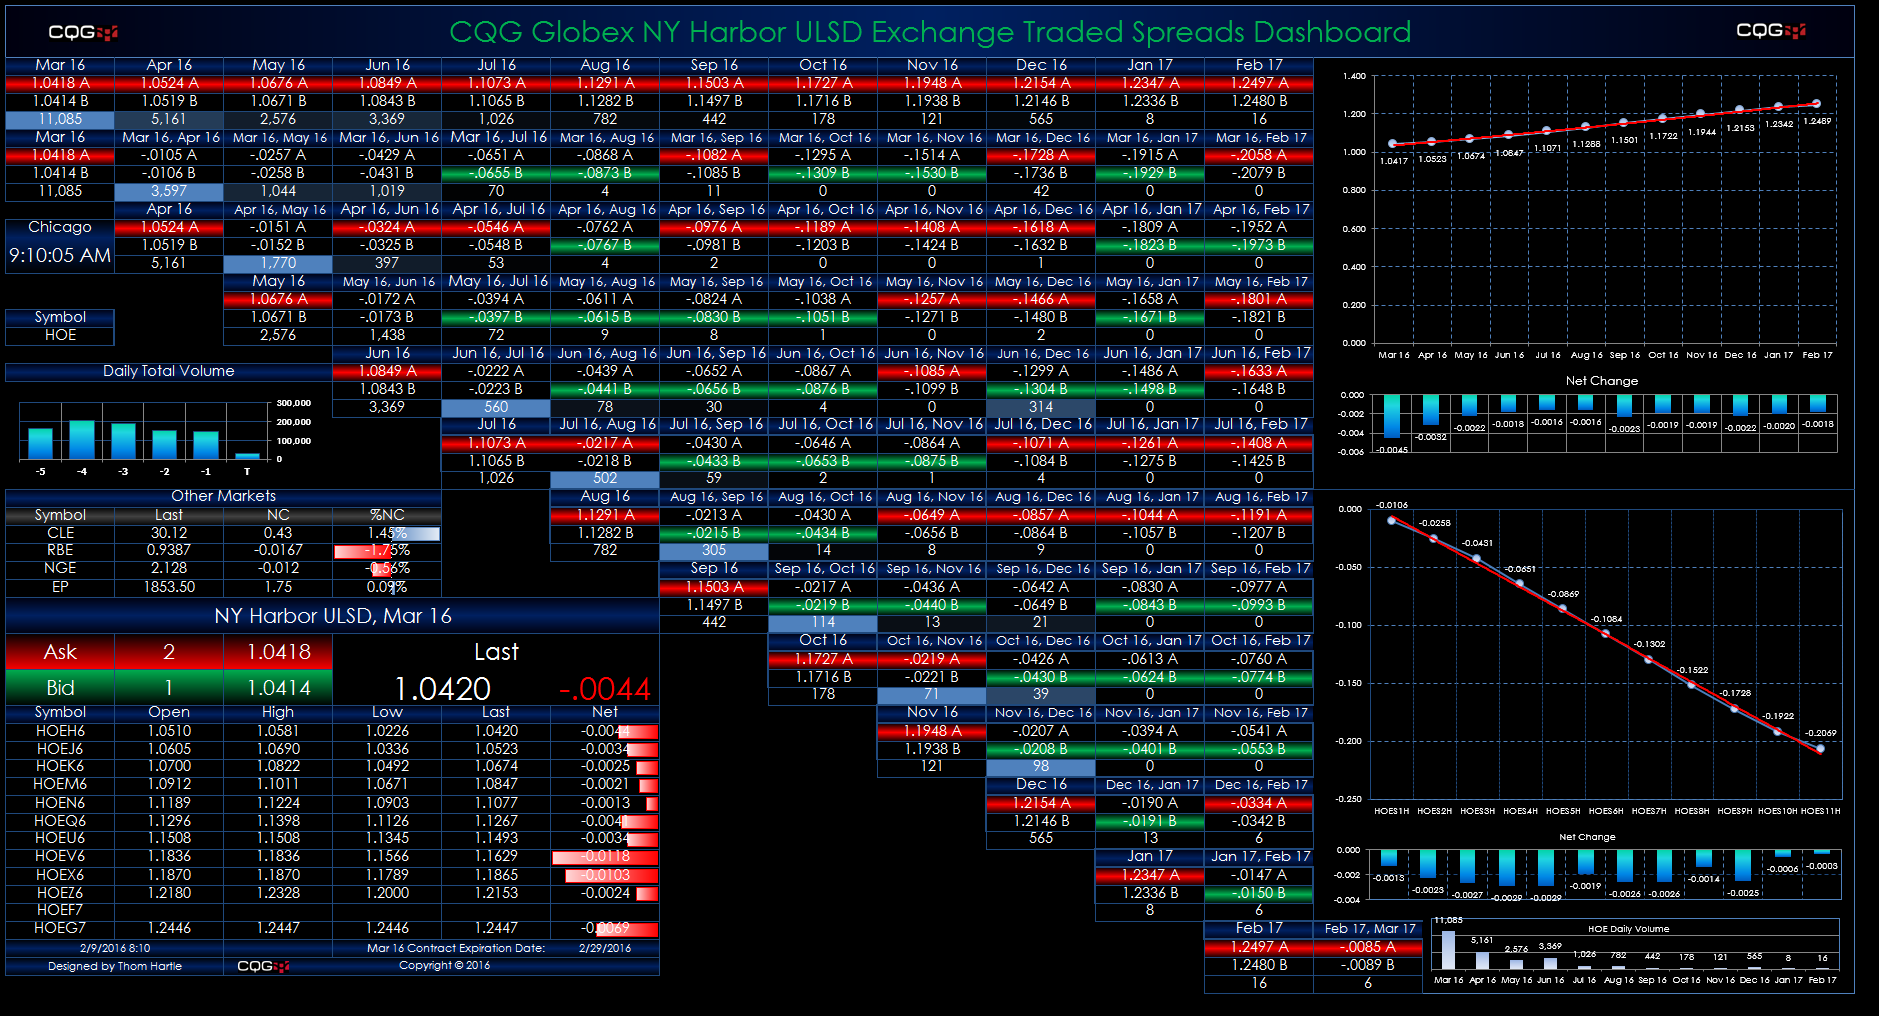
This Microsoft Excel® dashboard displays market data for heating oil spreads traded on the CME Globex platform. This monitor uses a matrix style format. The outrights are along the top row and the… more
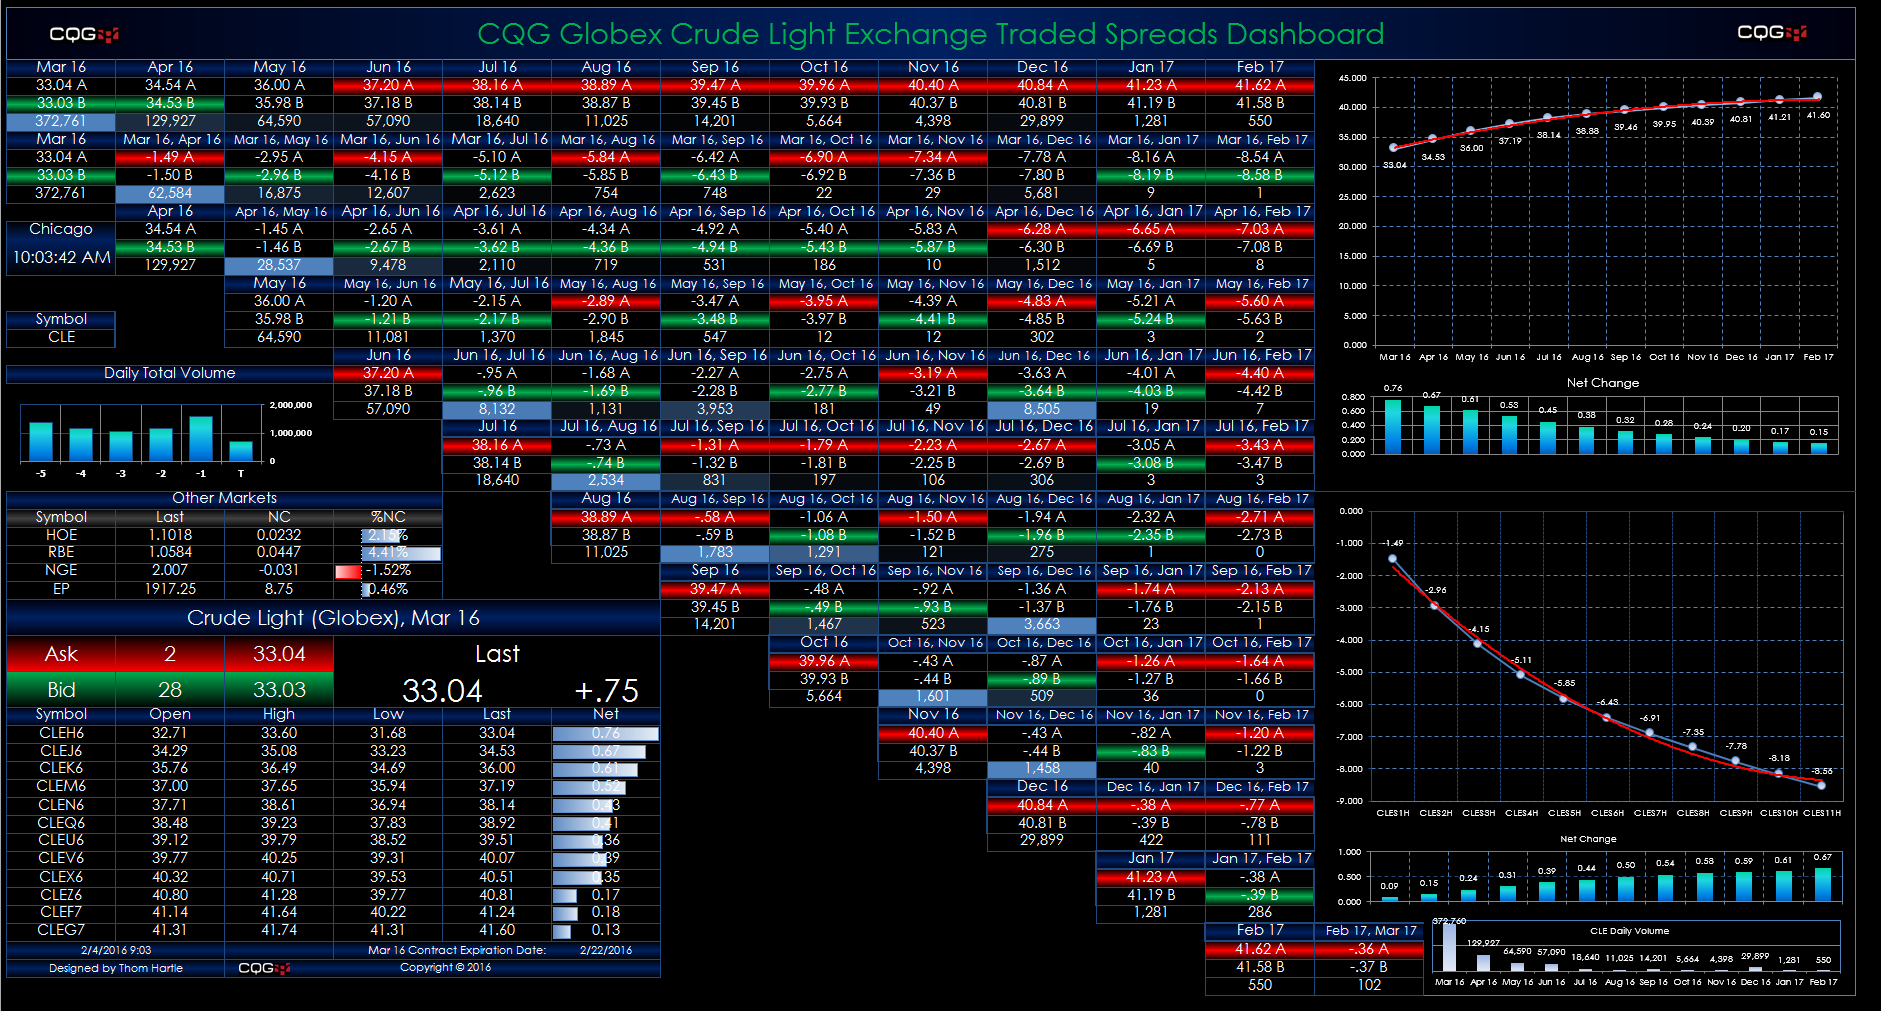
This Microsoft Excel® dashboard displays market data for crude oil spreads traded on the CME Globex platform. The dashboard is in a matrix-style format. The outrights are along the top row and the… more
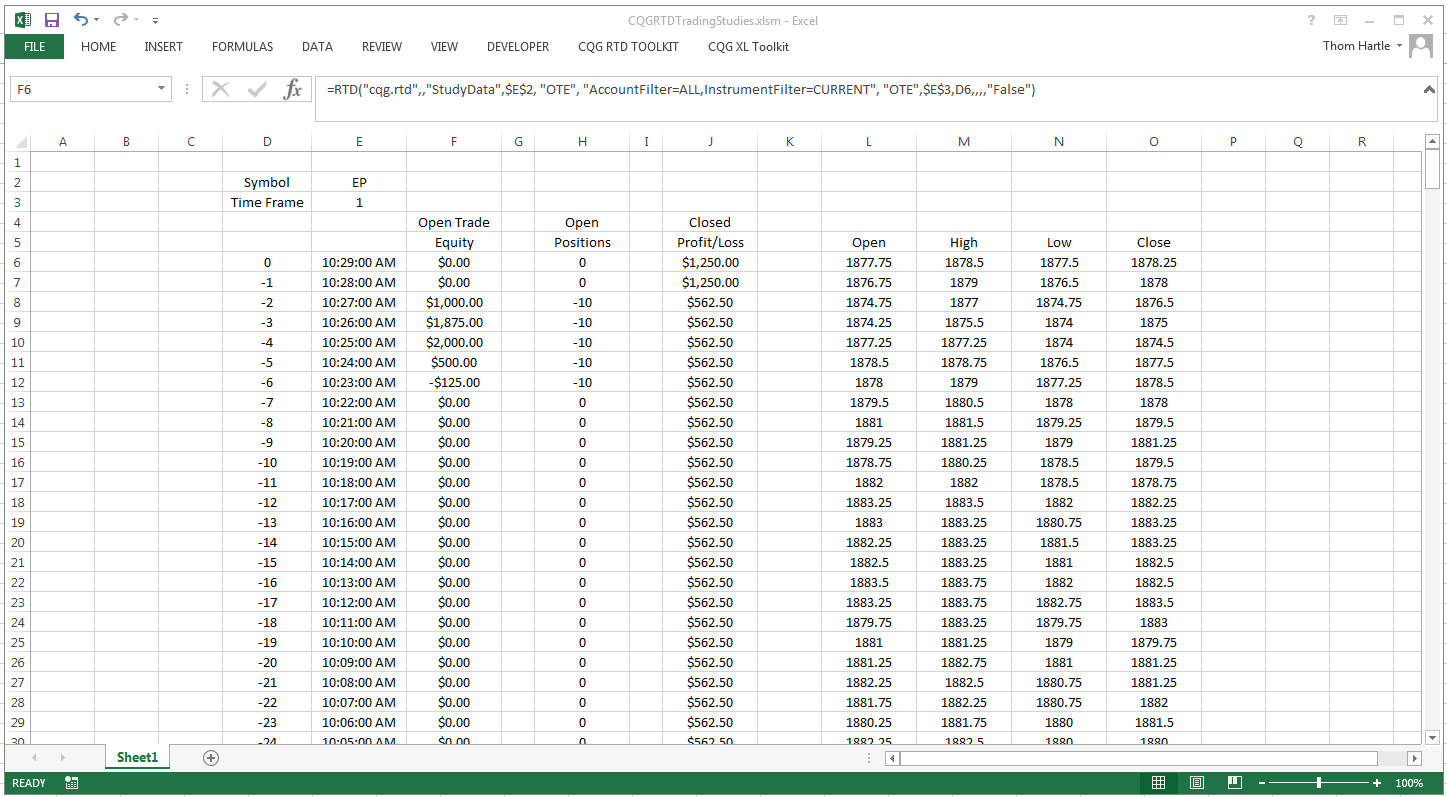
This Microsoft Excel® dashboard uses RTD formulas to pull the following CQG Trading Studies into Excel:
Open Trade Equity Position Profit & LossThese are study formulas and… more
Request:
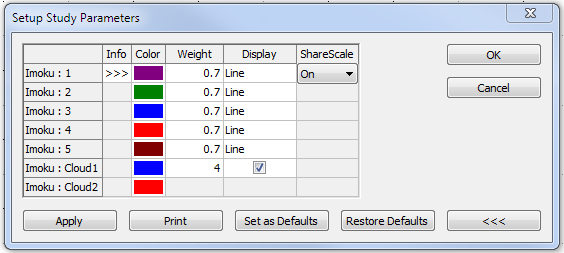
My Imoku study is not lining up over the bars and using the same scale as the price. How do I correct this?
Solution:
Right-click the study, select Modify Study.… more
Request:
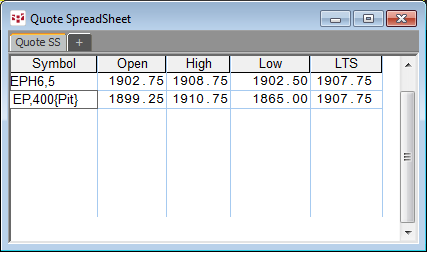
I would like to see in a quote display the same open, high, low, and close prices I see on a chart with a custom session.
Solution: Enter the symbol, then a comma… more
Request:
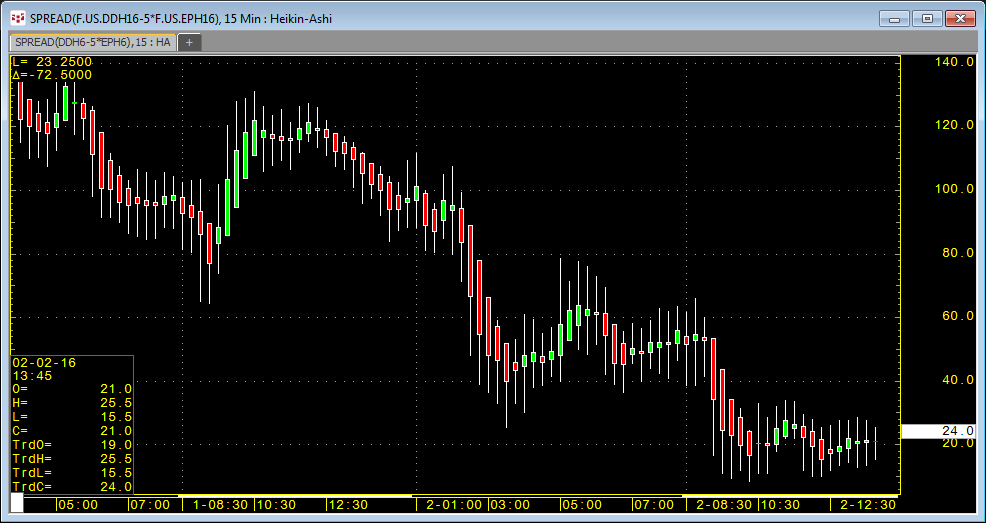
I want to chart the DDH6-EPH6*5 spread using a Heikin-Ashi chart. On a bar chart, I just see a closing line chart and it will not work in a Heikin-Ashi chart.
Solution:… more
Request:
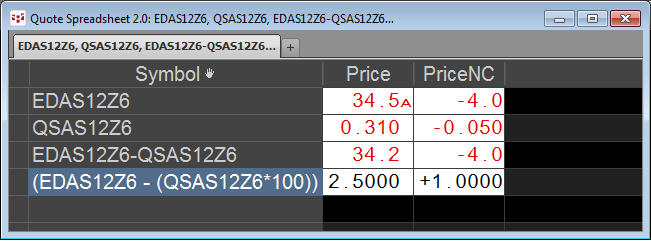
The 12m DEC16DEC17 Eurodollar and the 12m DEC16DEC17 Sterling spread should be around 2, but I see 34. Why is this?
Solution:
In CQG the EDA spread is quoted as… more
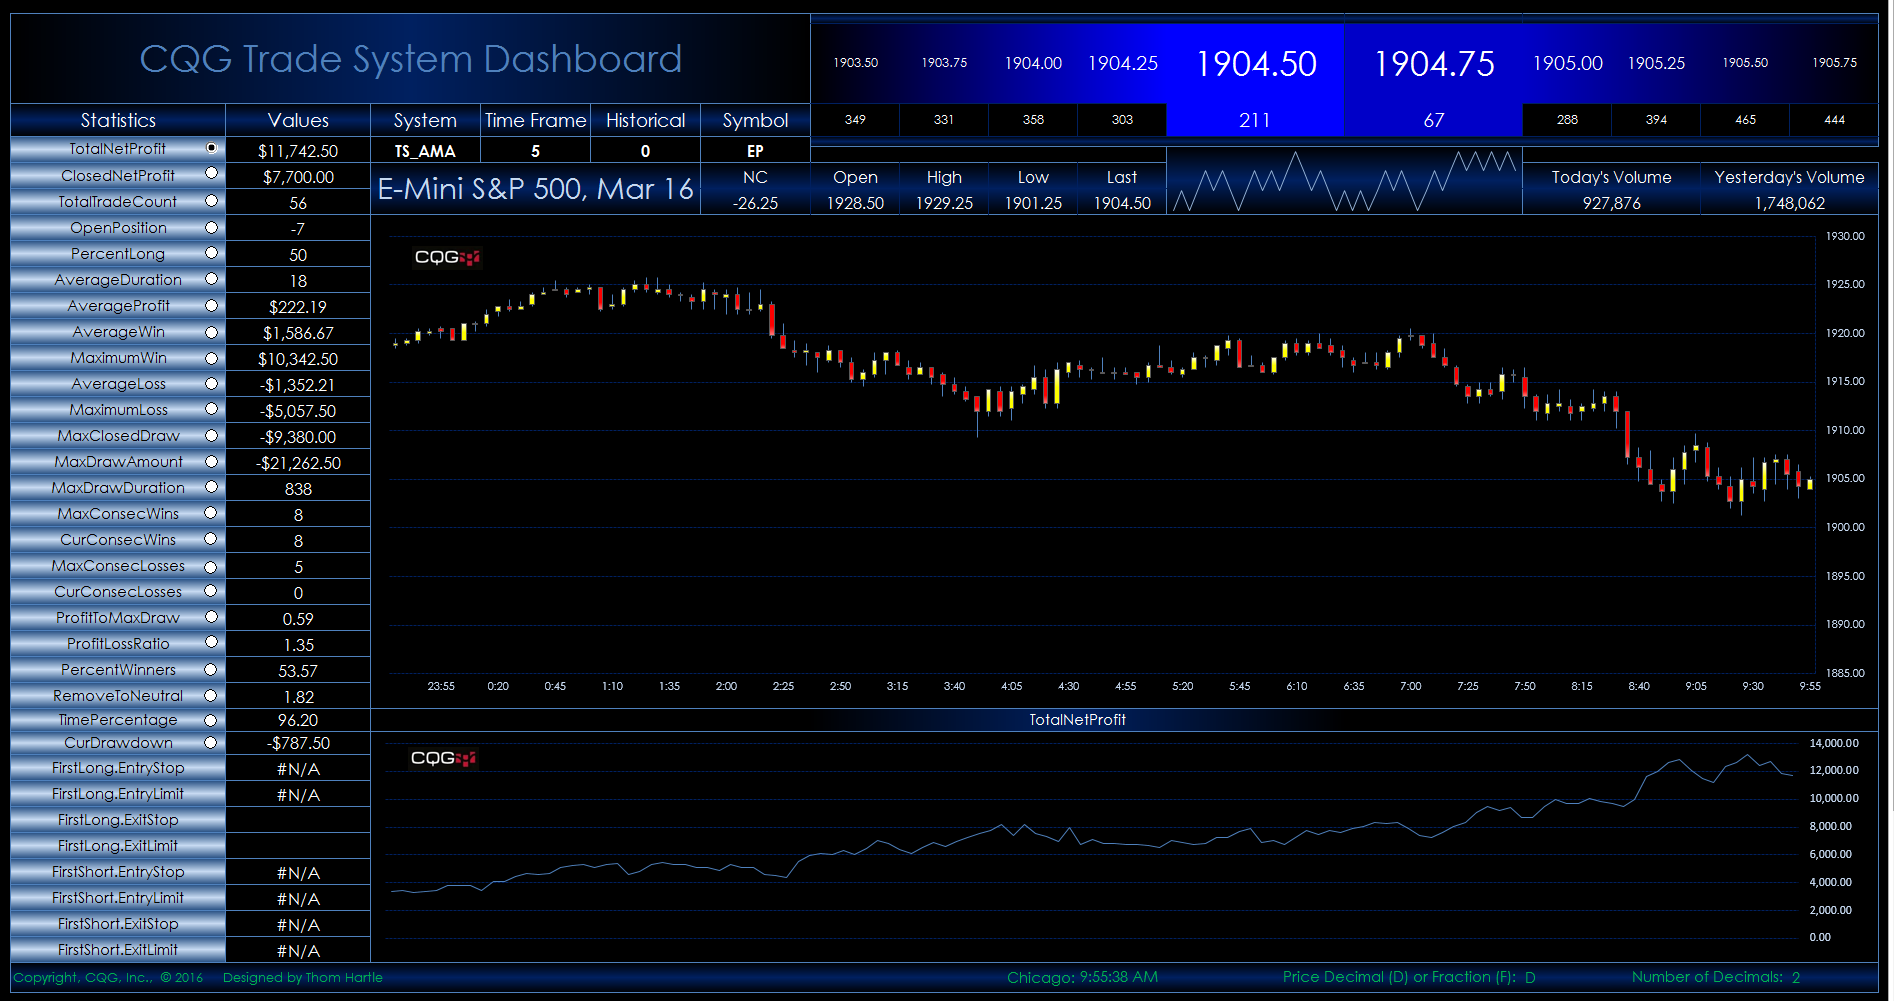
This Microsoft Excel® dashboard displays trade system statistics pulled from CQG’s Backtesting module. Enter the system's “short’ name, chart time frame, and symbol.
This new version… more
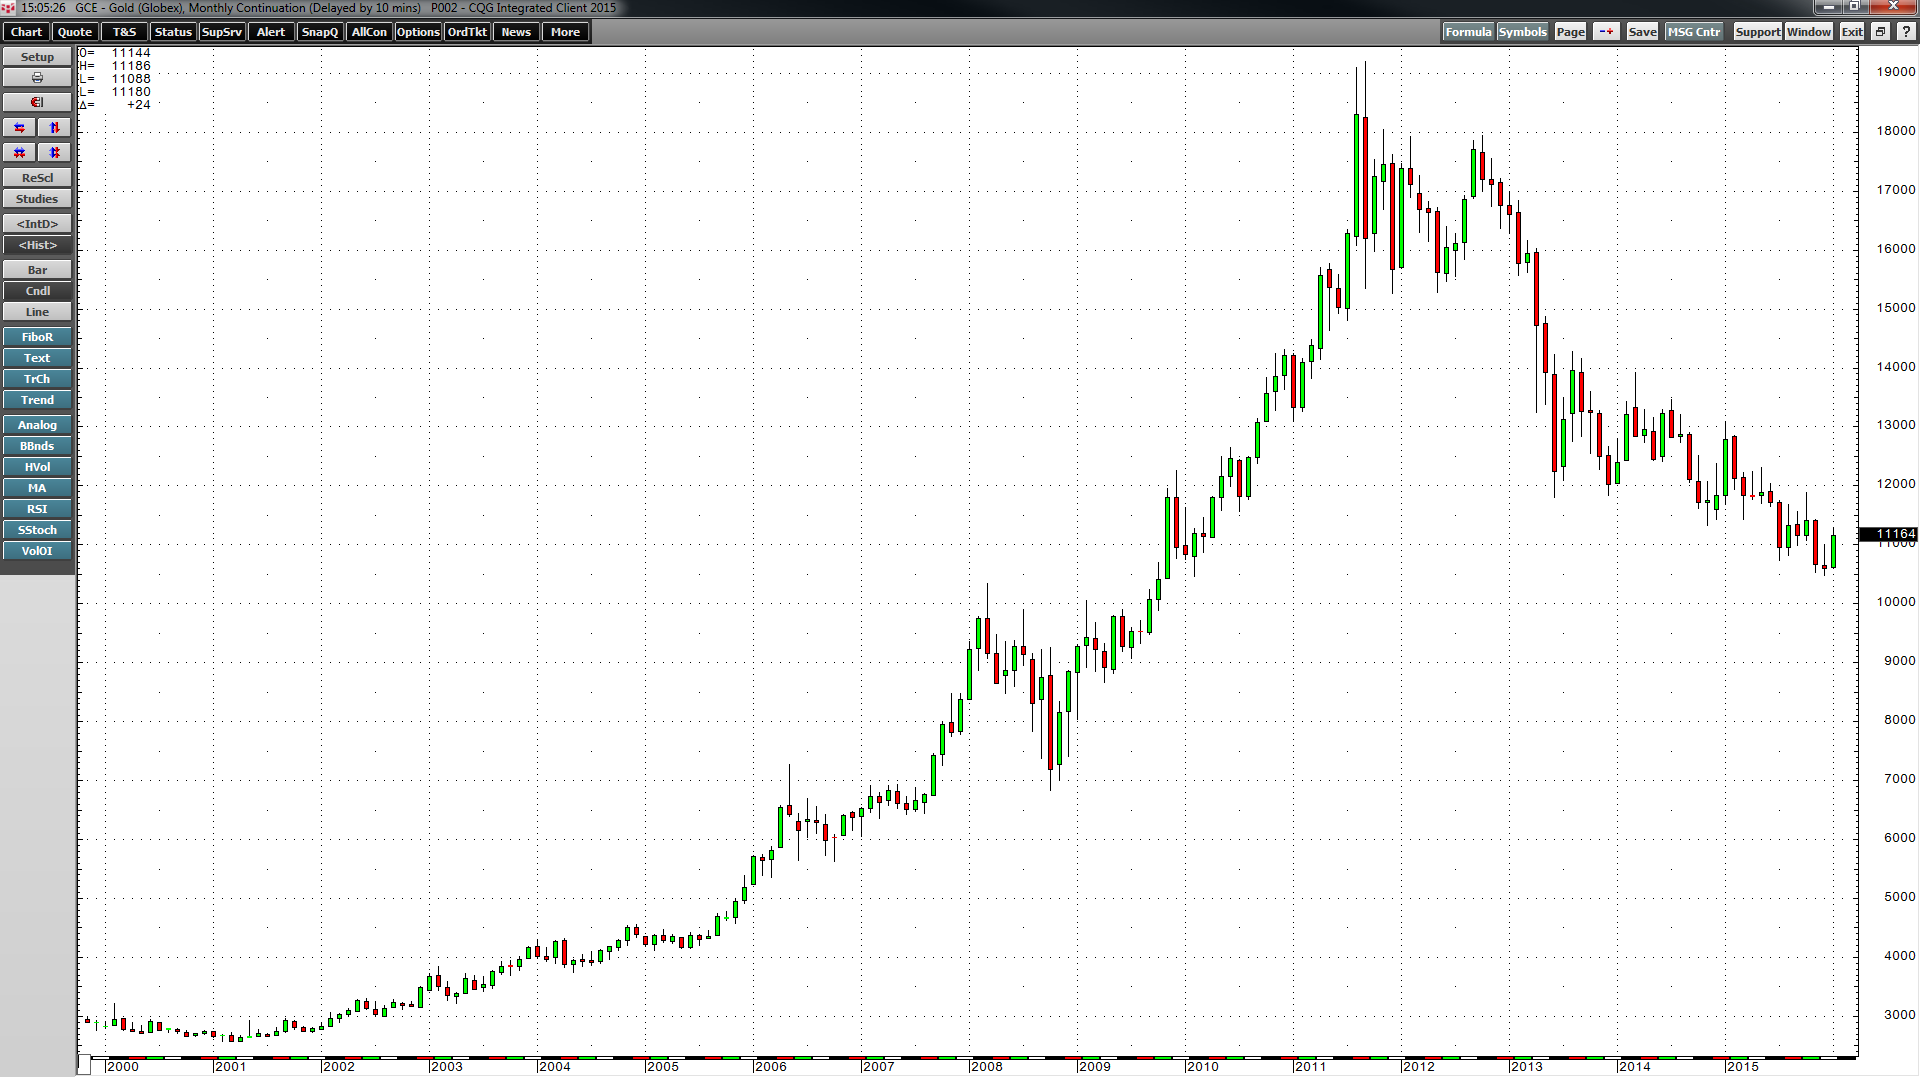
There is a big difference between price and value. Price is a transparent number where buyers and sellers meet to transact. Value is a concept that often goes much deeper. We can all watch asset… more