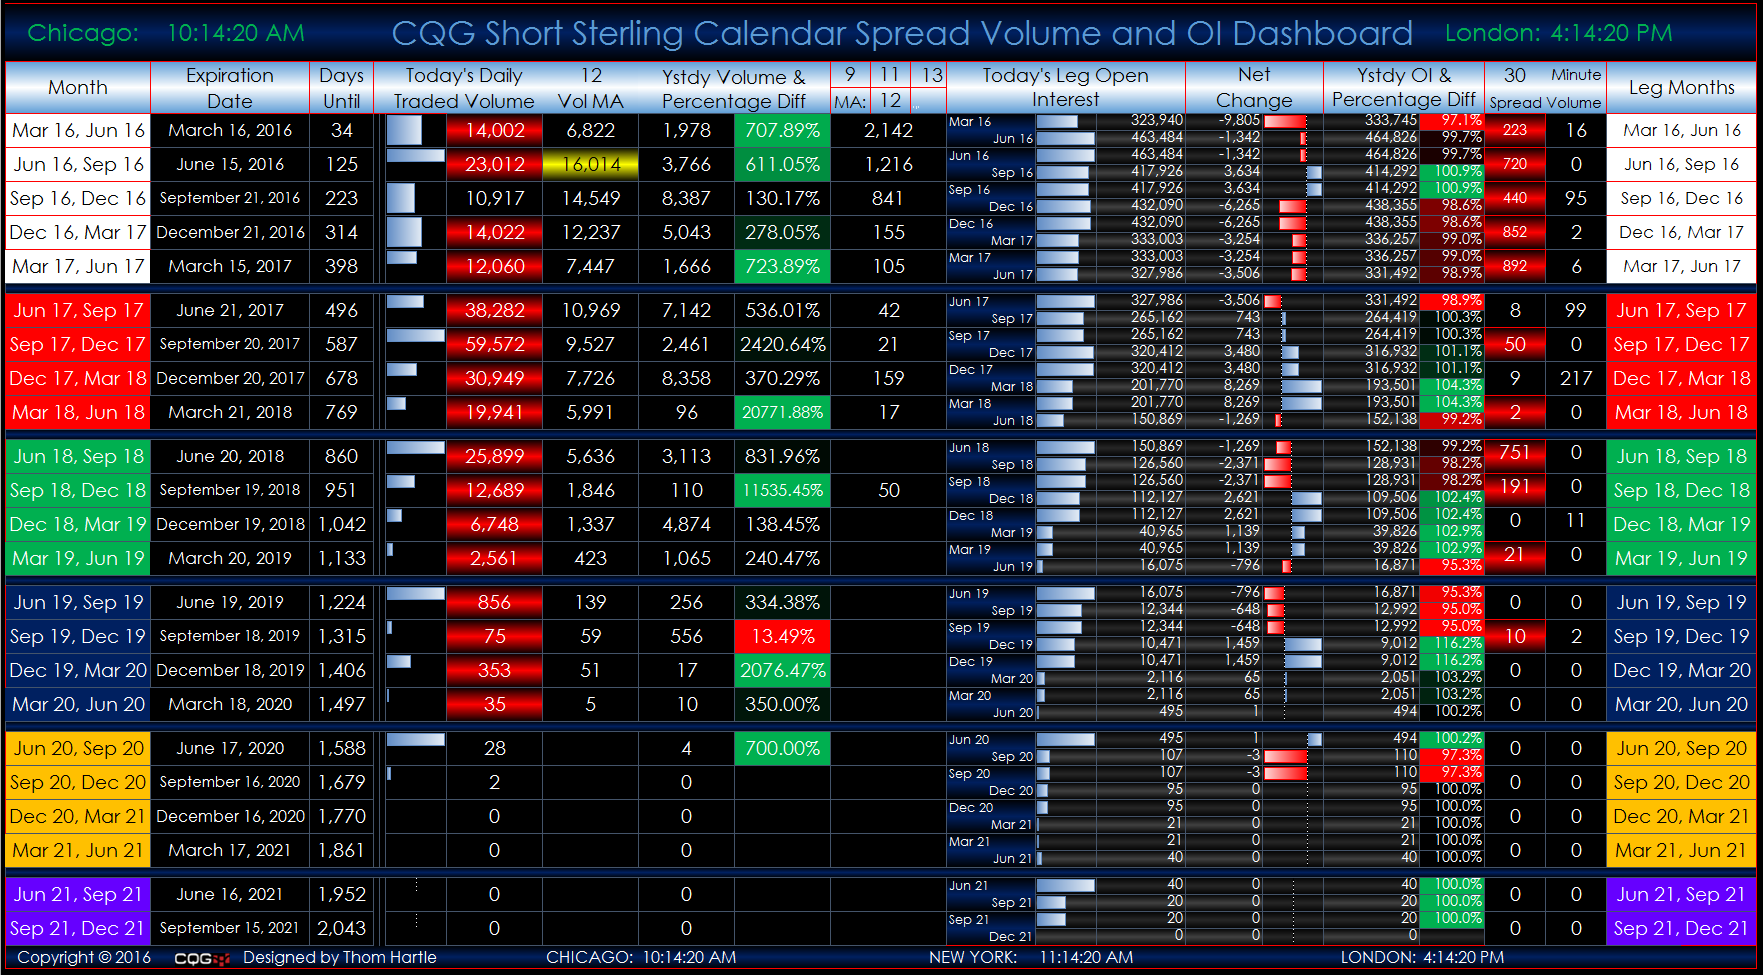
This Microsoft Excel® dashboard displays individual Short Sterling three-month calendar spreads and their individual legs for tracking the rolls. All of the active deliveries for each individual symbol are displayed in a single dashboard detailing market data. The volume column highlights, in gold, the contract that has the largest twelve-day moving average. You can change the look-back period for the moving average. You can also enter a calendar date and pull a moving average value of the volume from that date. The top five contracts by open interest are highlighted in gold. If the thirty-minute volume exceeds yesterday's thirty-minute volume for the same time, then the volume is highlighted in red.
For more STIRs Roll Dashboards, please visit news.cqg.com/workspaces/main/2014/08/cqg-stirs-futures-roll-excel-dashboards.html.
Requires CQG Integrated Client or CQG QTrader and Excel 2010 or more recent.