
This midweek look shows the Nikkei 225 (Osaka), Dec 26 contract, with a loss of -0.76%. The best performer in the US market is the E-mini NASDAQ 100, Dec 26 contract showing a gain of +2.24… more
Equities
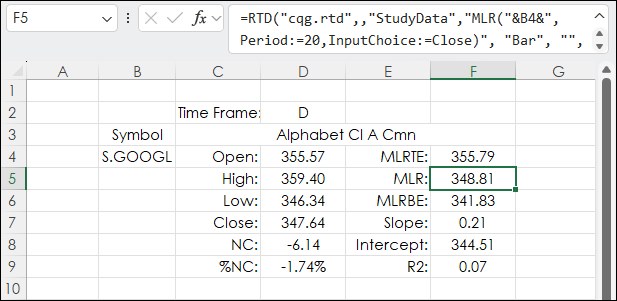
CQG offers the Moving Linear Regression Line study. When plotted on a chart the line (blue line below) is the endpoint of a best fit line using the least squares technique. This technique finds… more

This midweek look shows the Nikkei 225 (Osaka), Dec 26 contract, with a loss of -3.83%. The best performer in the US market is the E-mini Dow, Dec 26 contract showing a loss of -0.53%. The… more
This midweek look shows the Nikkei 225 (Osaka), Dec 26 contract, with a gain of +1.68%. The best performer in the US market is the E-mini S&P 500, Dec 26 contract showing a gain of +0.… more
This midweek look shows the Nikkei 225 (Osaka), Dec 26 contract, with a gain of +1.51%. The best performer in the US market is the E-mini NASDAQ-100, Dec 26 contract showing a loss of -0.11… more
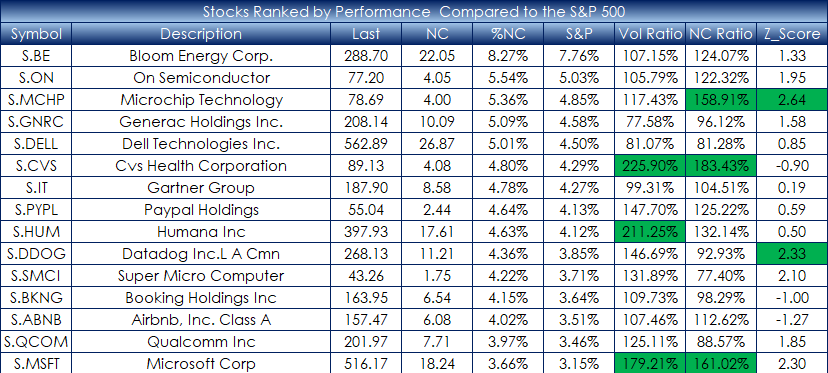
This post details using Excel's MAP function to rank the companies in the S&P 500 index performance relative to the S&P 500 index's performance. This is defined by today's percentage net… more
This midweek look shows the Nikkei 225 (Osaka), Dec 26 contract, with a gain of +1.29%. The best performer in the US market is the E-mini NASDAQ-100, Dec 26 contract showing a gain of +2.81… more
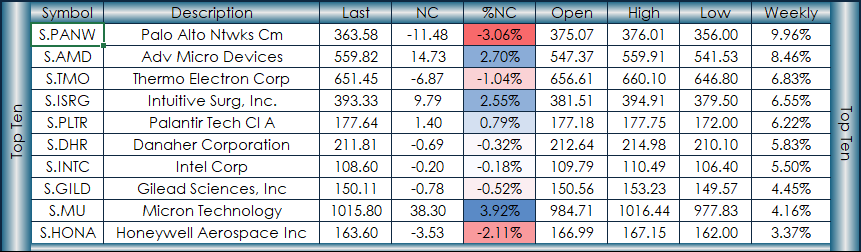
This post combines four Excel functions for managing market performance measurements. The market performance measurements are the top ten and bottom ten percentage net changes. The time periods… more
This midweek look shows the Nikkei 225 (Osaka), Sep 26 contract, with a gain of +0.77%. The best performer in the US market is the E-mini S&P 500, Sep 26 contract showing a loss of -0.… more
This midweek look shows the Nikkei 225 (Osaka), Sep 26 contract, with a loss of -1.00%. The best performer in the US market is the E-mini NASDAQ -100, Sep 26 contract showing a loss of -0.… more