
This post details the RTD calls to pull in TFlow bar data and TFlow On Balance Volume (TFOBV) study data into Excel. In addition, two functionalities are highlighted: One, how to find parameters for a study from the CQG Formula Builder to use in an RTD formula and two, how to display time stamps in milliseconds.
A caveat: TFlow bar data builds very quickly within CQG and pulling the real-time data into Excel using RTD formulas when the market is open can be challenging for the computer.
The sample spreadsheet is using TFlow bars that are aggregated (set to 5-bar aggregation). This compresses TFlow market data. You can aggregate TFlow in three ways: by bars, by range, and smoothing. Aggregated TFlow bars provide the same information as one-tick bars, but they are compressed into a single bar based on the number of bars or range.
Setting the aggregation to five bars (aggregation = bars, aggregation level = 5) tells the system to combine every five TFlow bars into one TFlow bar.
To build the RTD formulas for the TFlow bars the symbol is needed. In these examples, the market symbol and the TFlow aggregation parameters are passed together. The steps to build the combination start with opening the Formula builder. Select Bar Value and then expand the TFlow group.
Select the TFlow Open and insert that into the Formula box.
Then select the name of the custom study, here "Test" is the name and right-click, then select "Send to Clipboard."
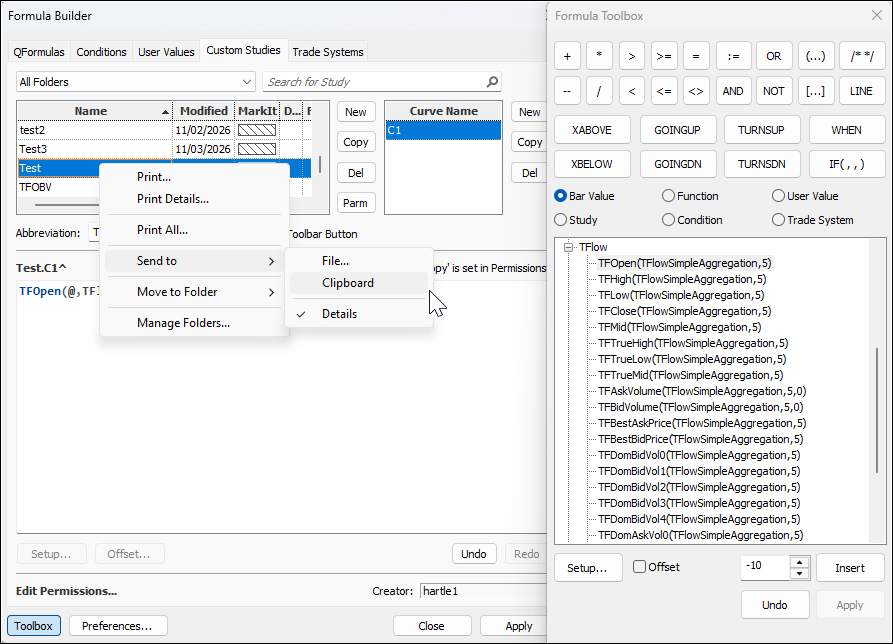
Then paste in an Excel spreadsheet. What is copied to the Clipboard and then pasted to the Excel sheet is this:
Current Time 11/04/26 11:24

Test: -- Overlaid = TRUE

Parameters:

Days = 20

Curve 'C1 (Display String)

TFOpen(@,TFlowSimpleAggregation,5)

Curve 'C1 (Study String)   TFOpen(@,FillDOMData:=0,AggregateBy:=TFlowSimpleAggregation,Aggregation:=5,VolThreshold:=0)
From above what is needed for the RTD formula is this:
TFOpen(@,TFlowSimpleAggregation,5)
Here is the syntax to query study data by RTD:
= RTD("CQG.RTD", , "StudyData", "<contract>", "<study>"[, "<study parameters>"], "<field(s)>", "<interval>" [, "<bar index(es)>"][, "<session filter>"][, "< custom session >"] [, "<BATS filter>"] [, "<equalize close>"] [, "<data format>"]) For the Open of the TFlow Bar used in Column C this RTD formula is used with the TFlowOpen in the "contract" parameter:
=RTD("cqg.rtd",,"StudyData","TFOpen("&$M$2&",TFlowSimpleAggregation,"&$M$14&")", "Bar", "", "Close", $M$4, $A2, $M$6,$M$10,,$M$8,M$12)The various parameters used in the RTD formula are referencing cells in the spreadsheet:
Within the parameter for the "contract" the concatenate function "&" is used:
TFOpen("&$M$2&",TFlowSimpleAggregation,"&$M$14&")The symbol is cell M2 and the Aggregation is cell M14. The TFlow data is using the Primary Session.
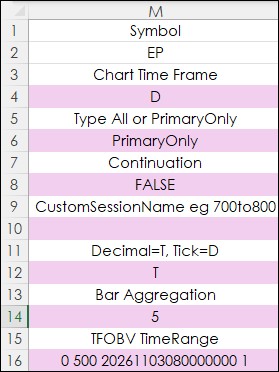
There is a time stamp with the open of each Aggregated TFlow bar. In column B the RTD formula for Time uses the MOD function because the RTD formula returns the date and time as a string with a decimal. The date is the left side of the decimal and the time is the right side of the decimal. The Mod function removes the date:
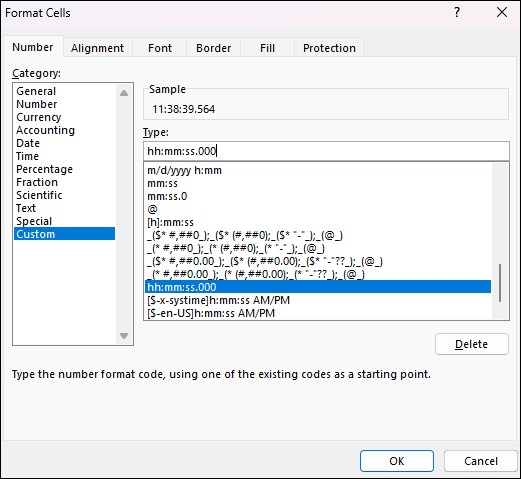
=MOD(RTD("cqg.rtd",,"StudyData","TFOpen(EP,TFlowSimpleAggregation,"&$M$14&")", "Bar", "", "Time", $M$4, $A2, $M$6,$M$10,,$M$8,M$12),1)The Time is listed in column B of the sample spreadsheet. The time returned includes milliseconds. To format the column to display the Time with milliseconds copy and paste this into the Type box of the Custom category of the Format Cells interface:
hh:mm:ss.000
Then format the column with that Type.
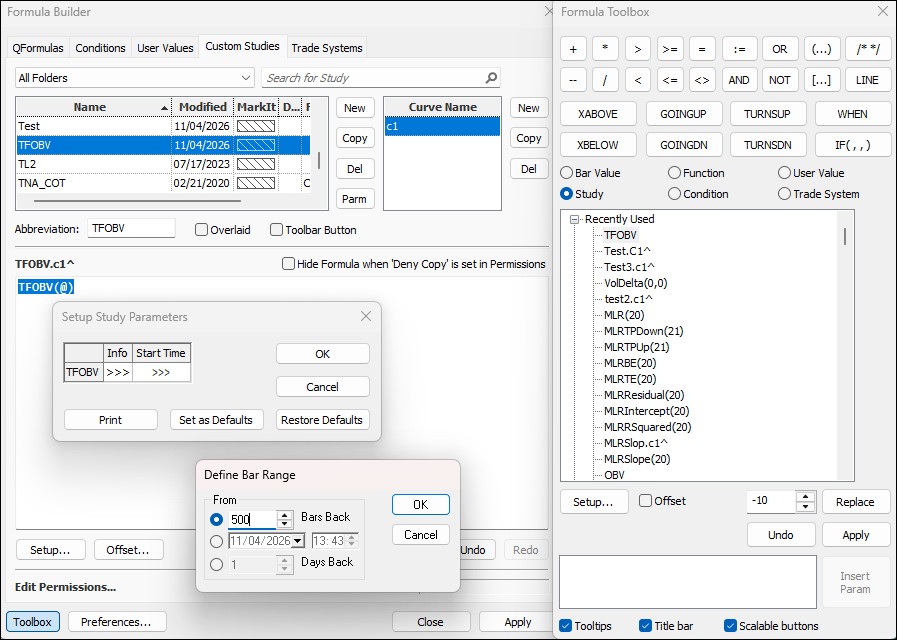
Column G is the TFOBV study. One parameter is the Start Time. In the RTD formula the Start Time parameter is called TimeRange. To find the proper string to use for the parameter add a custom study in the Formula builder, here it is called TFOBV.
Then insert the TFOBV study from the Formula Toolbox. Click Setup.
Then click Start Time. Then define the bar range back, here 500 was used.
Then select and right-click the Name of the study and select Send to Clipboard.
Then paste it into a spreadsheet. Below is what appears.
Current Time 11/04/26 12:31

TFOBV: -- Overlaid = FALSE

Curve 'c1 (Display String)

TFOBV(@)

Curve 'c1 (Study String)

TFOBV(@,TimeRange:="0 500 20261104133000000 1")
What is needed is the string for the TimeRange. Select it and paste into Cell M16.
Here is the full RTD formulas for the TFOBV study displayed in Column G:
=RTD("cqg.rtd",,"StudyData", "(TFlowSimpleAggregation(TFlowOp("&$M$2&", 0, 0),"&$M$14&"))","TFOBV", "TimeRange="&$M$16&"", "TFOBV",$M$4, $A2, $M$6,$M$10,,$M$8,M$12)Here are the remaining RTD formulas:
Column D (TFlowHigh):
=RTD("cqg.rtd",,"StudyData","TFHigh("&$M$2&",TFlowSimpleAggregation,"&$M$14&")", "Bar", "", "Close", $M$4, $A2, $M$6,$M$10,,$M$8,M$12)Column E (TFlowLow):
=RTD("cqg.rtd",,"StudyData","TFLow("&$M$2&",TFlowSimpleAggregation,"&$M$14&")", "Bar", "", "Close", $M$4, $A2, $M$6,$M$10,,$M$8,M$12)Column F (TFlowClose):
=RTD("cqg.rtd",,"StudyData","TFClose("&$M$2&",TFlowSimpleAggregation,"&$M$14&")", "Bar", "", "Close", $M$4, $A2, $M$6,$M$10,,$M$8,M$12)Here is an image of the Sample Spreadsheet:
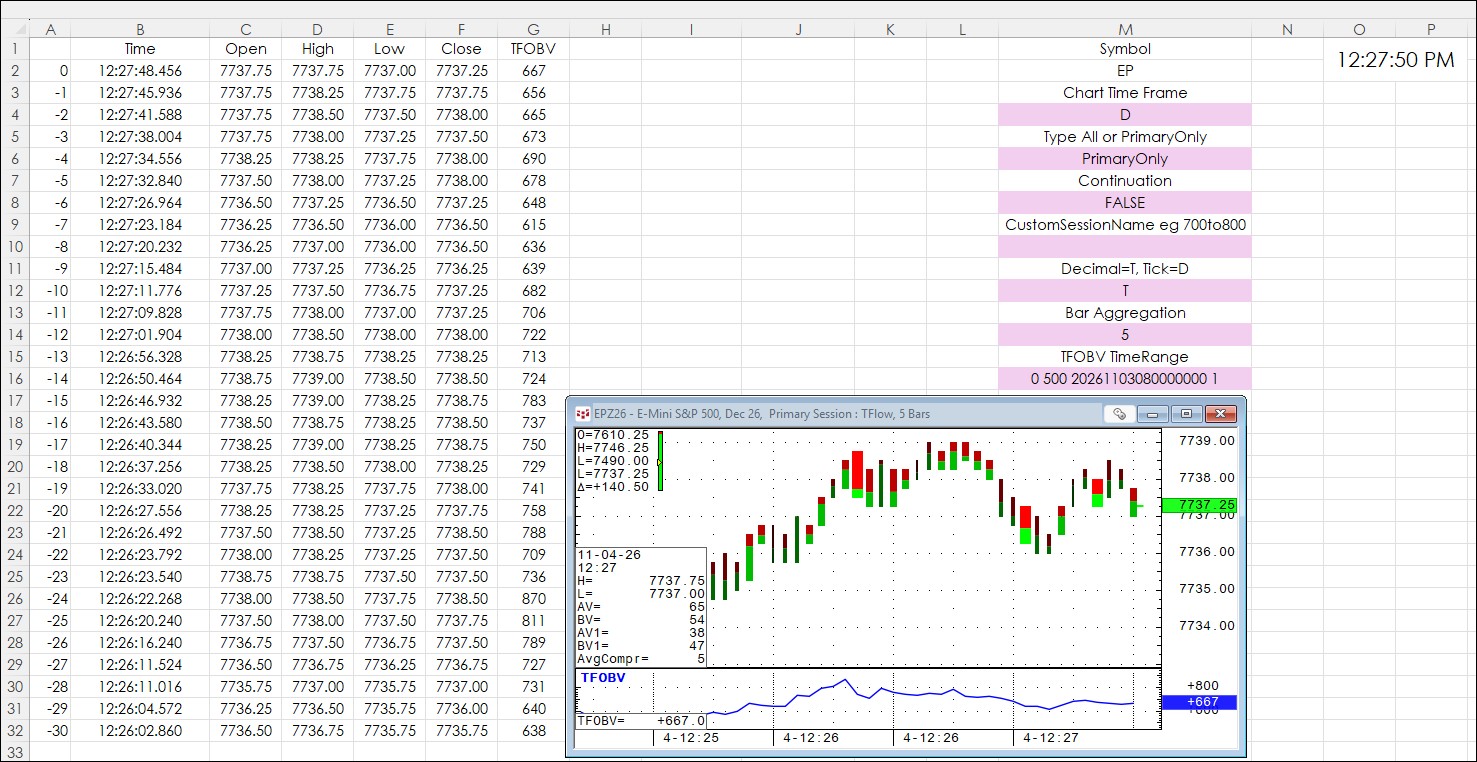
This post detailed pulling in TFlow Bar data and the TFlow On Balance Volume study. In addition, using custom formatting for milliseconds was explained as well pulling parameters from the Formula Builder. For more details regarding using the Formula Builder for this purpose check out this post.
Make sure to lower your Excel Realtime Data (RTD) throttle to 100 milliseconds. Learn how to do that here.
Requires CQG Integrated Client or CQG QTrader, and Excel 365 or more recent locally installed, not in the Cloud.