
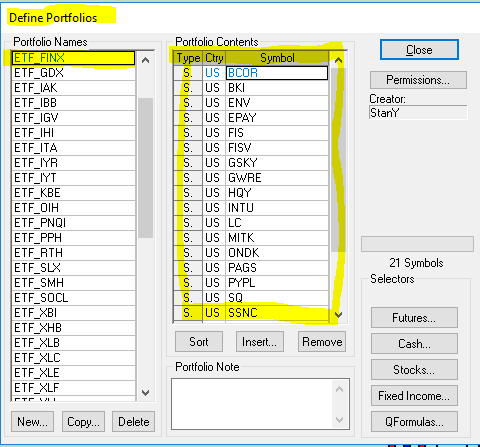
The pac files available below for download represent equity sectors. ;Each sector is composed of specific Exchange Traded Funds (ETF). Each EFT contains a portfolio of the individual equities that… more
Workspaces
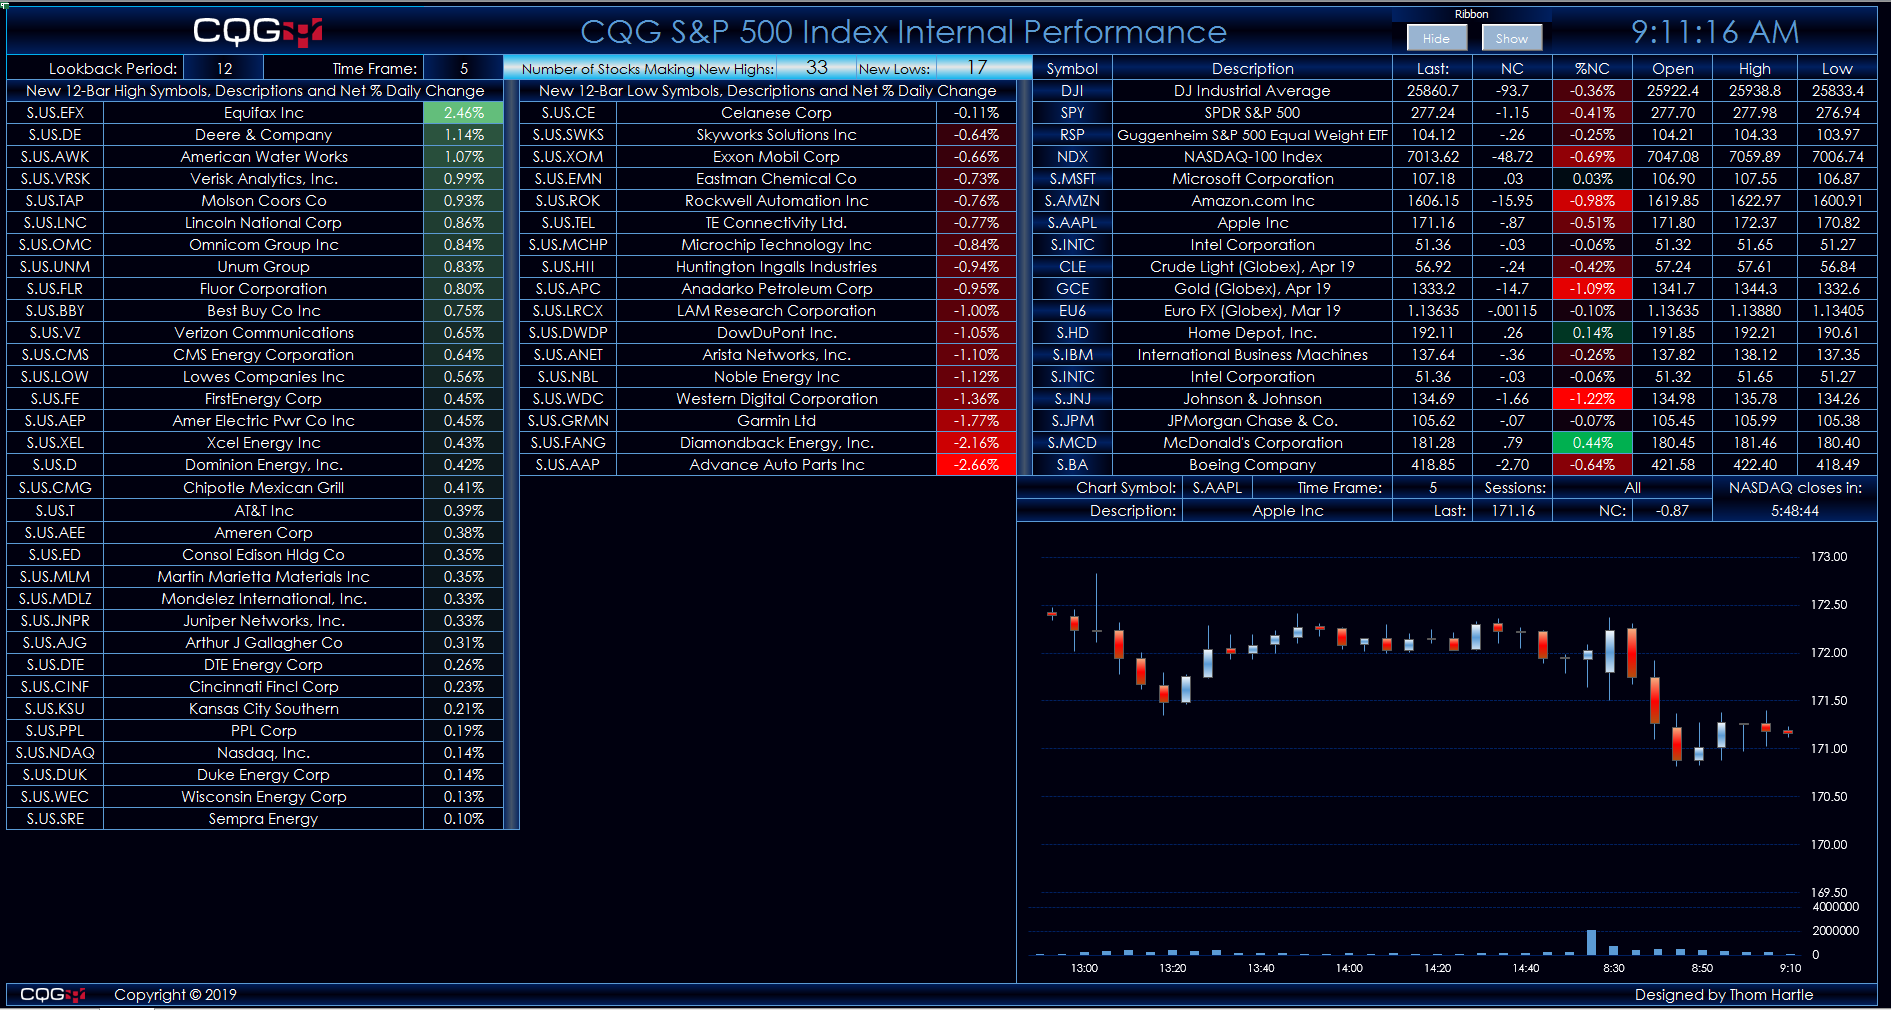
This Microsoft Excel® dashboard tracks the 506 stocks in the S&P 500 index using CQG’s Level function. The Level function plots two lines, which identify the highest and lowest price levels… more
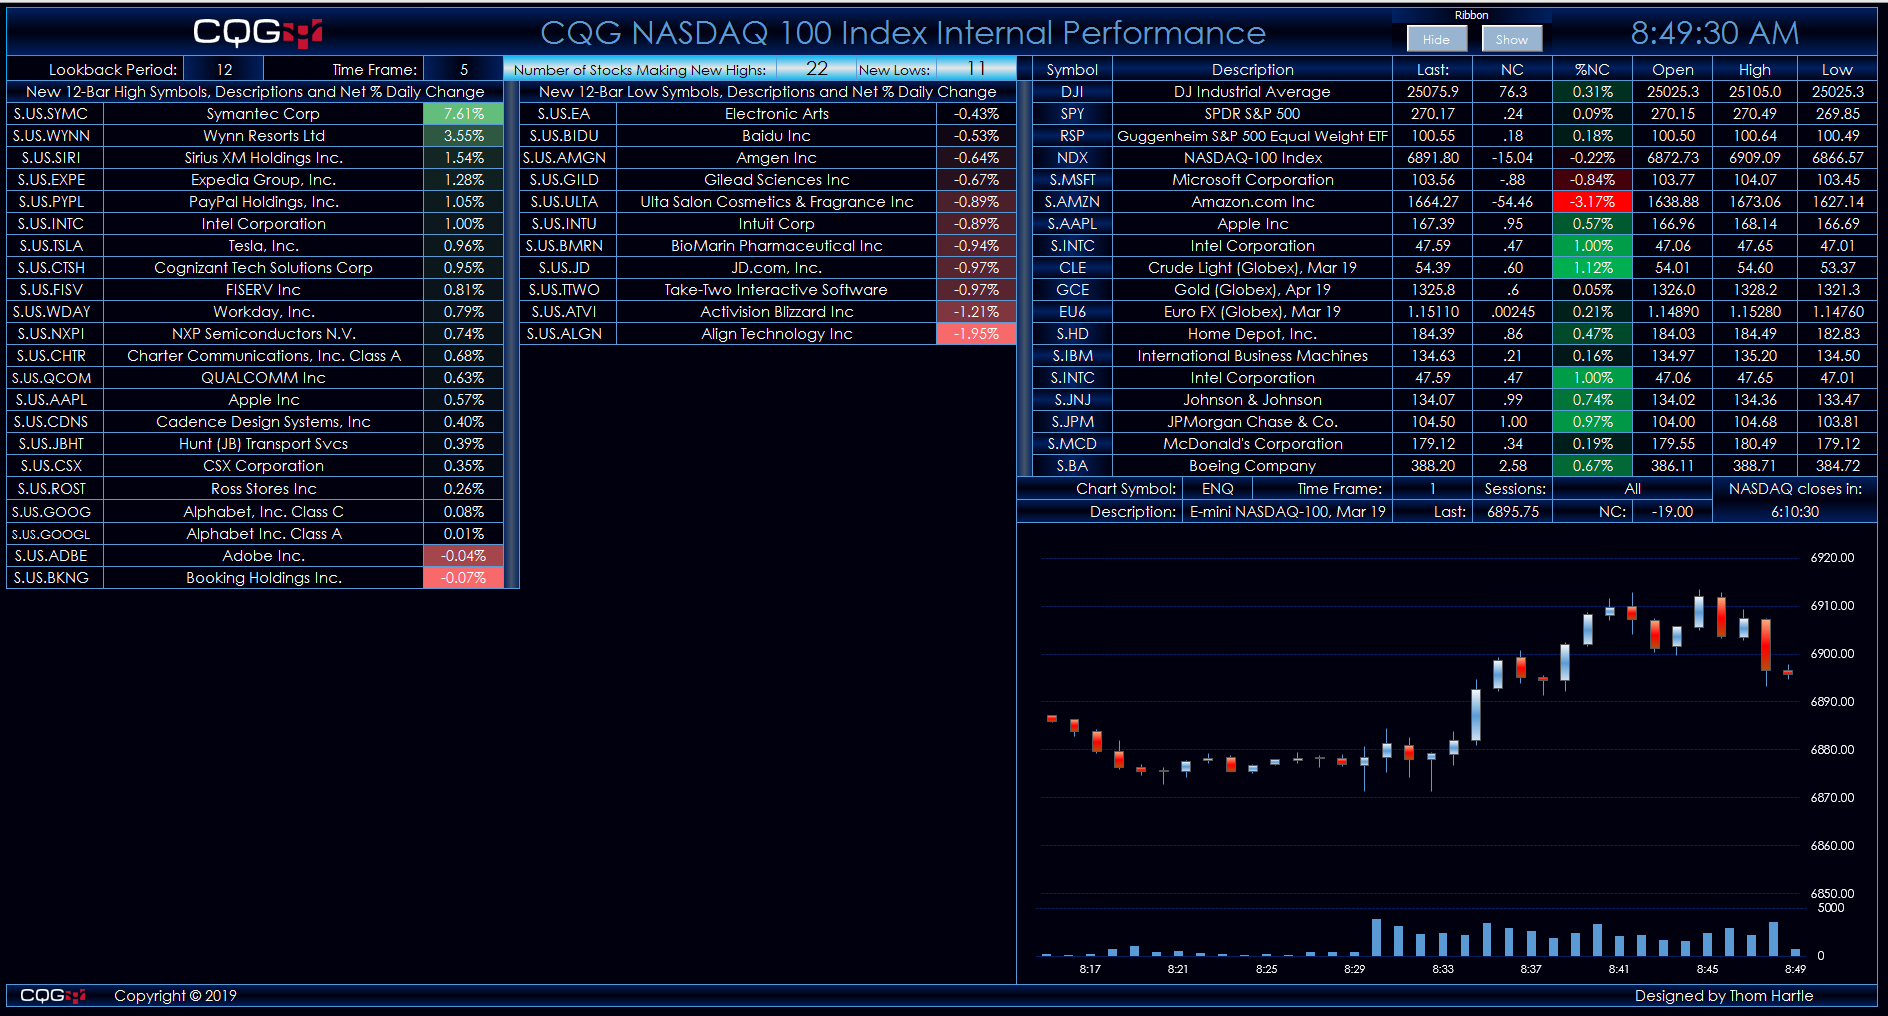
This Microsoft Excel® dashboard tracks the 104 stocks in the Nasdaq-100 index using CQG’s Level function. The Level function plots two lines, which identify the highest and lowest price levels… more
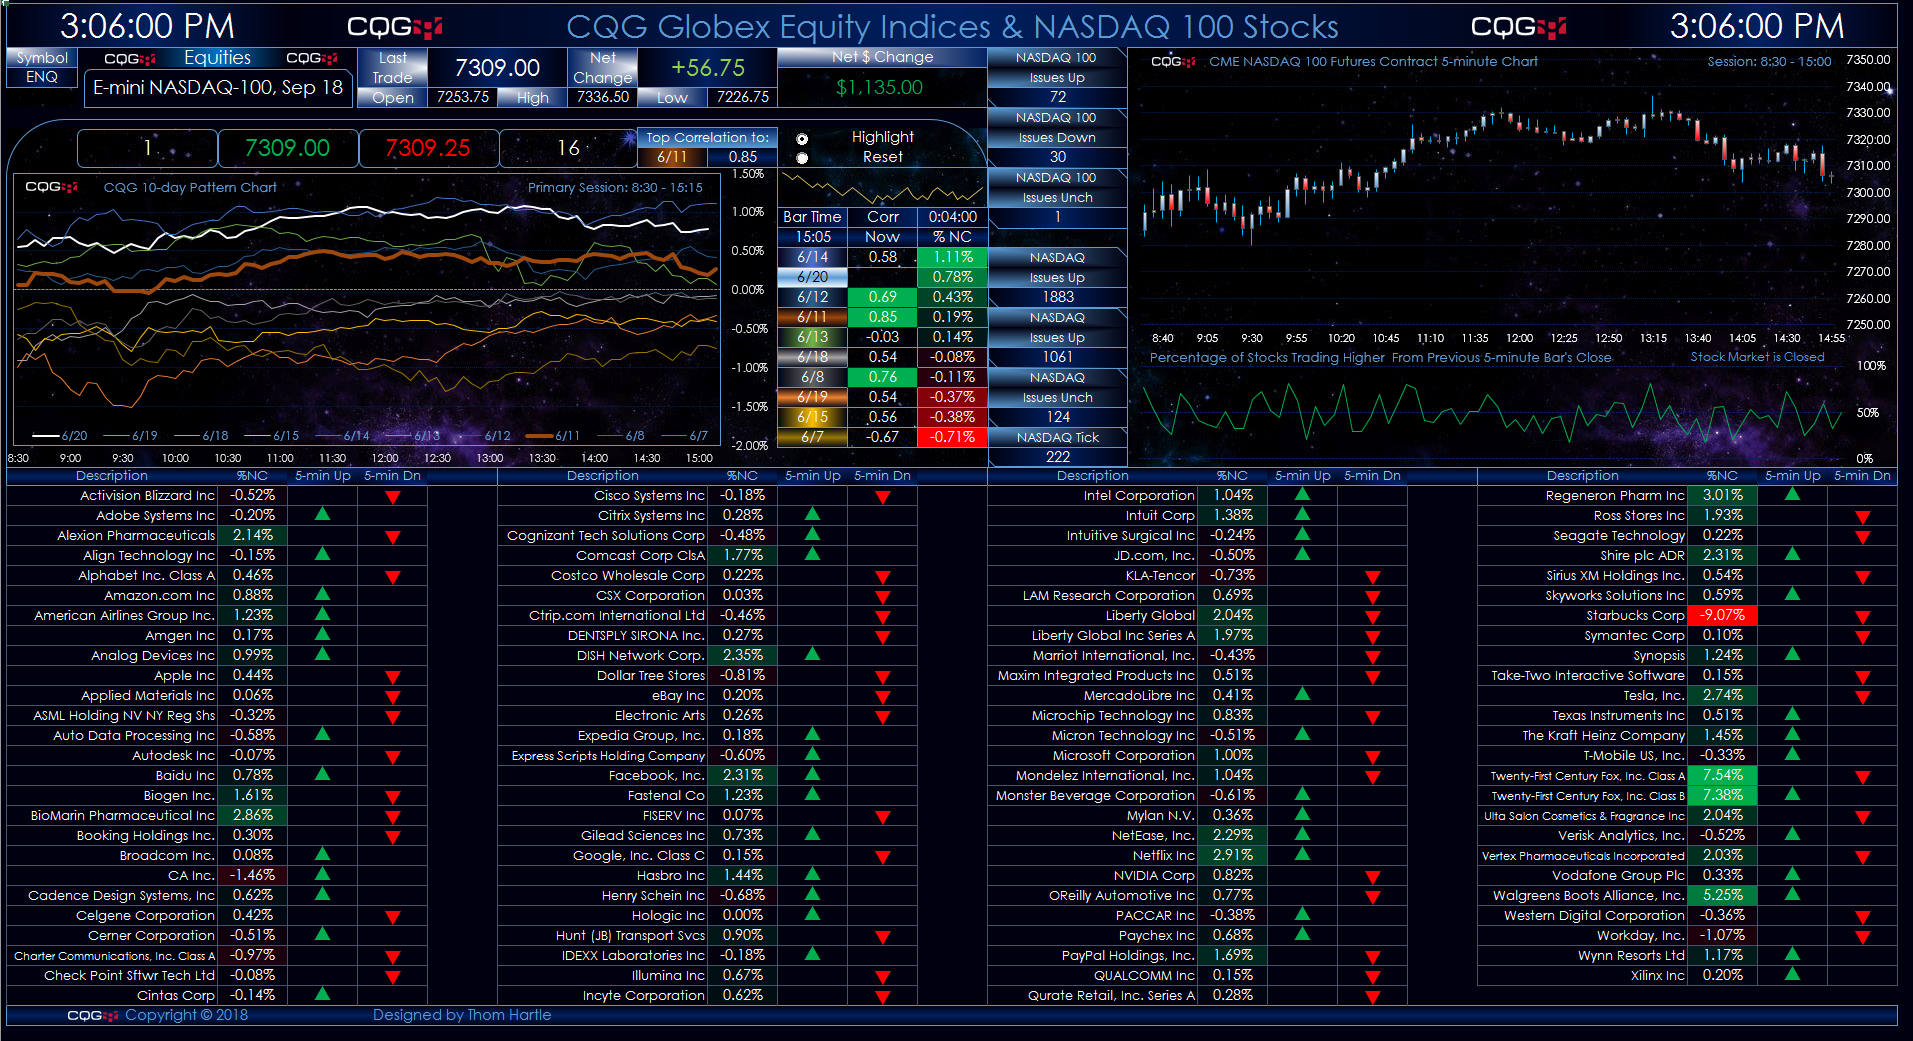
This Microsoft Excel® dashboard presents two charts of the Nasdaq-100 futures contract and market data for the one hundred stocks that are constituents of the Nasdaq 100 Index.
… more
This Microsoft Excel® dashboard displays the cash indices available from the Hang Seng Indexes Company.
The quote displays are divided into four sections. The first section is the cash Hang… more

This macro-enabled Microsoft Excel® spreadsheet tracks the holdings of the Invesco S&P 500® Equal Weight Technology ETF (symbol: RYT). This ETF seeks to replicate, before fees and expenses,… more
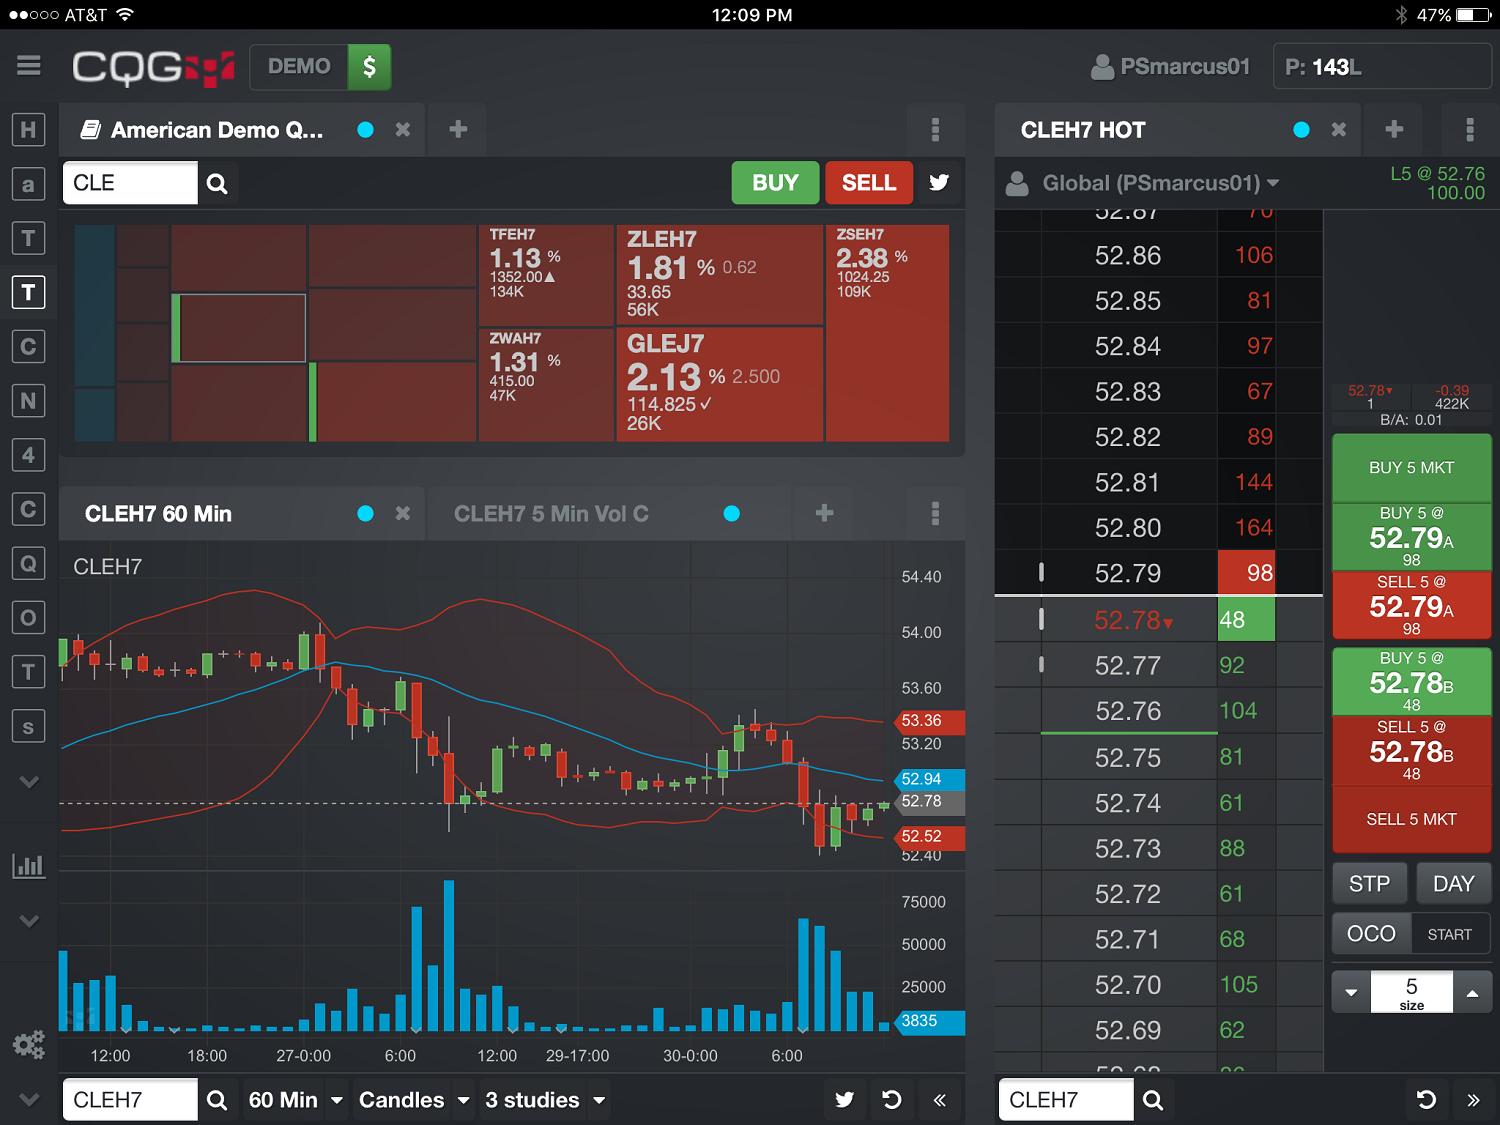
This CQG M dashboard layout displays a portfolio of symbols from the Americas (available with a subscription to the CME Globex feed on CQG) in a heat-map style. Tapping on a quote pushes the… more
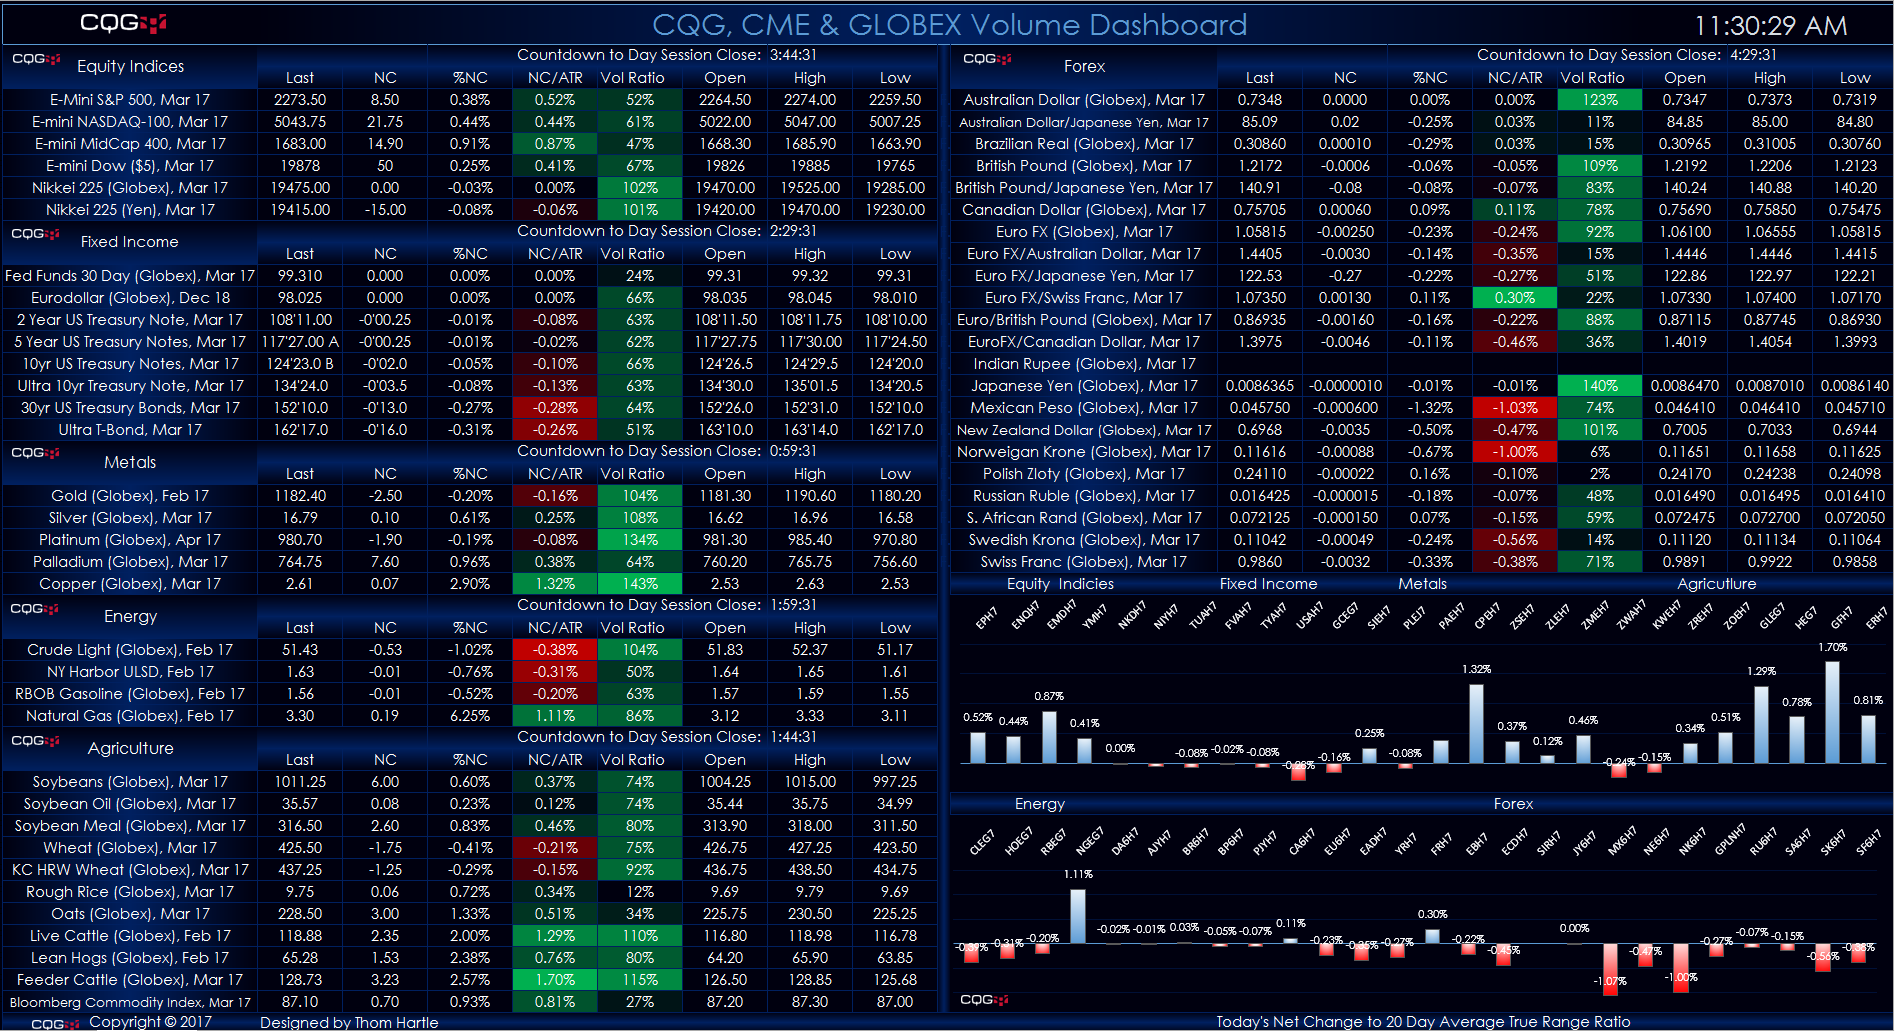
This Microsoft Excel® dashboard displays key market information for contracts traded on the CME Exchange and the Globex platform. The markets are grouped by these products:
Equity Indices… more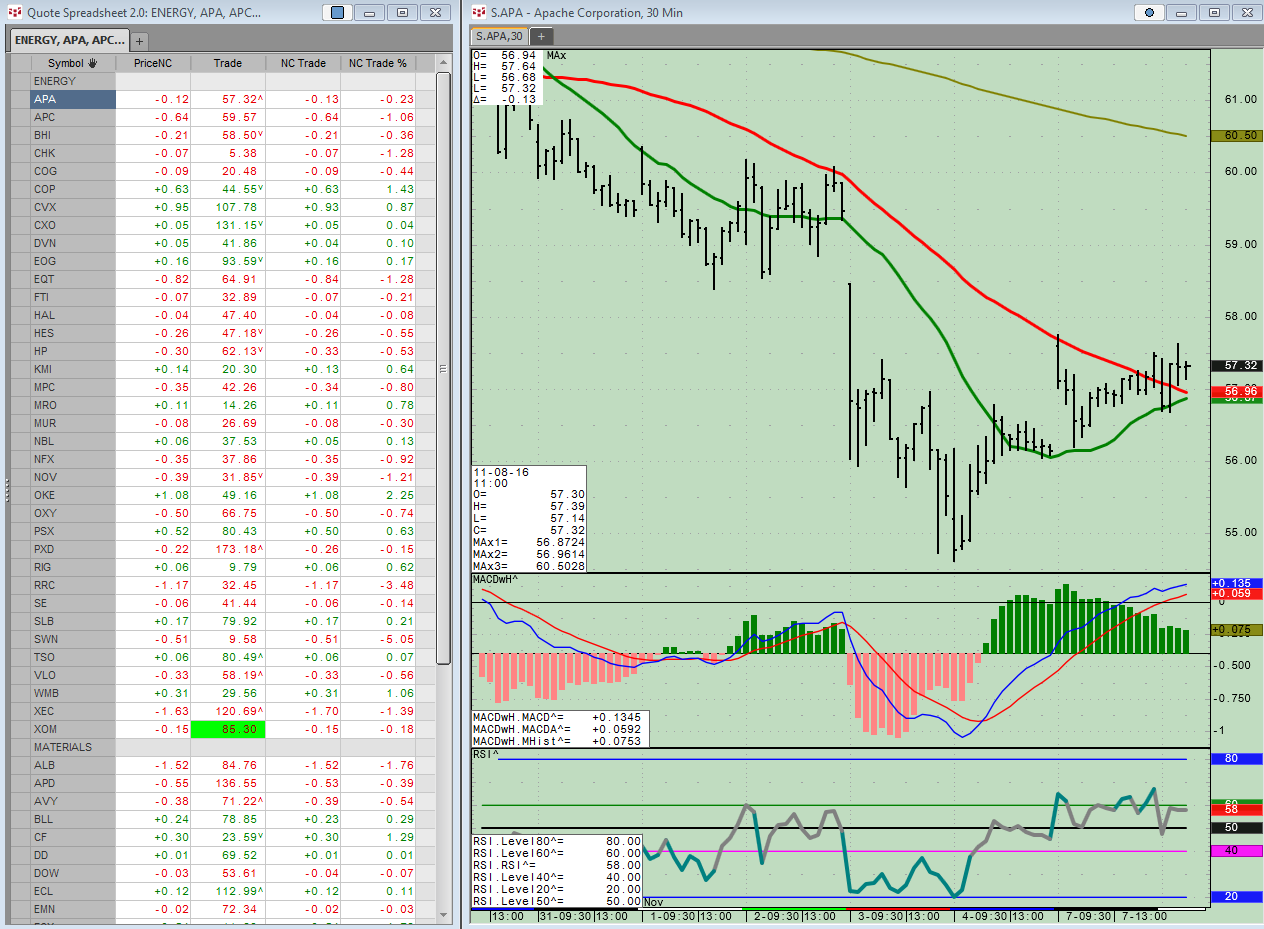
The component pac at the end of this article contains holdings or components of eleven SPDR ETF portfolios. You can use a portfolio to create a quote page… more
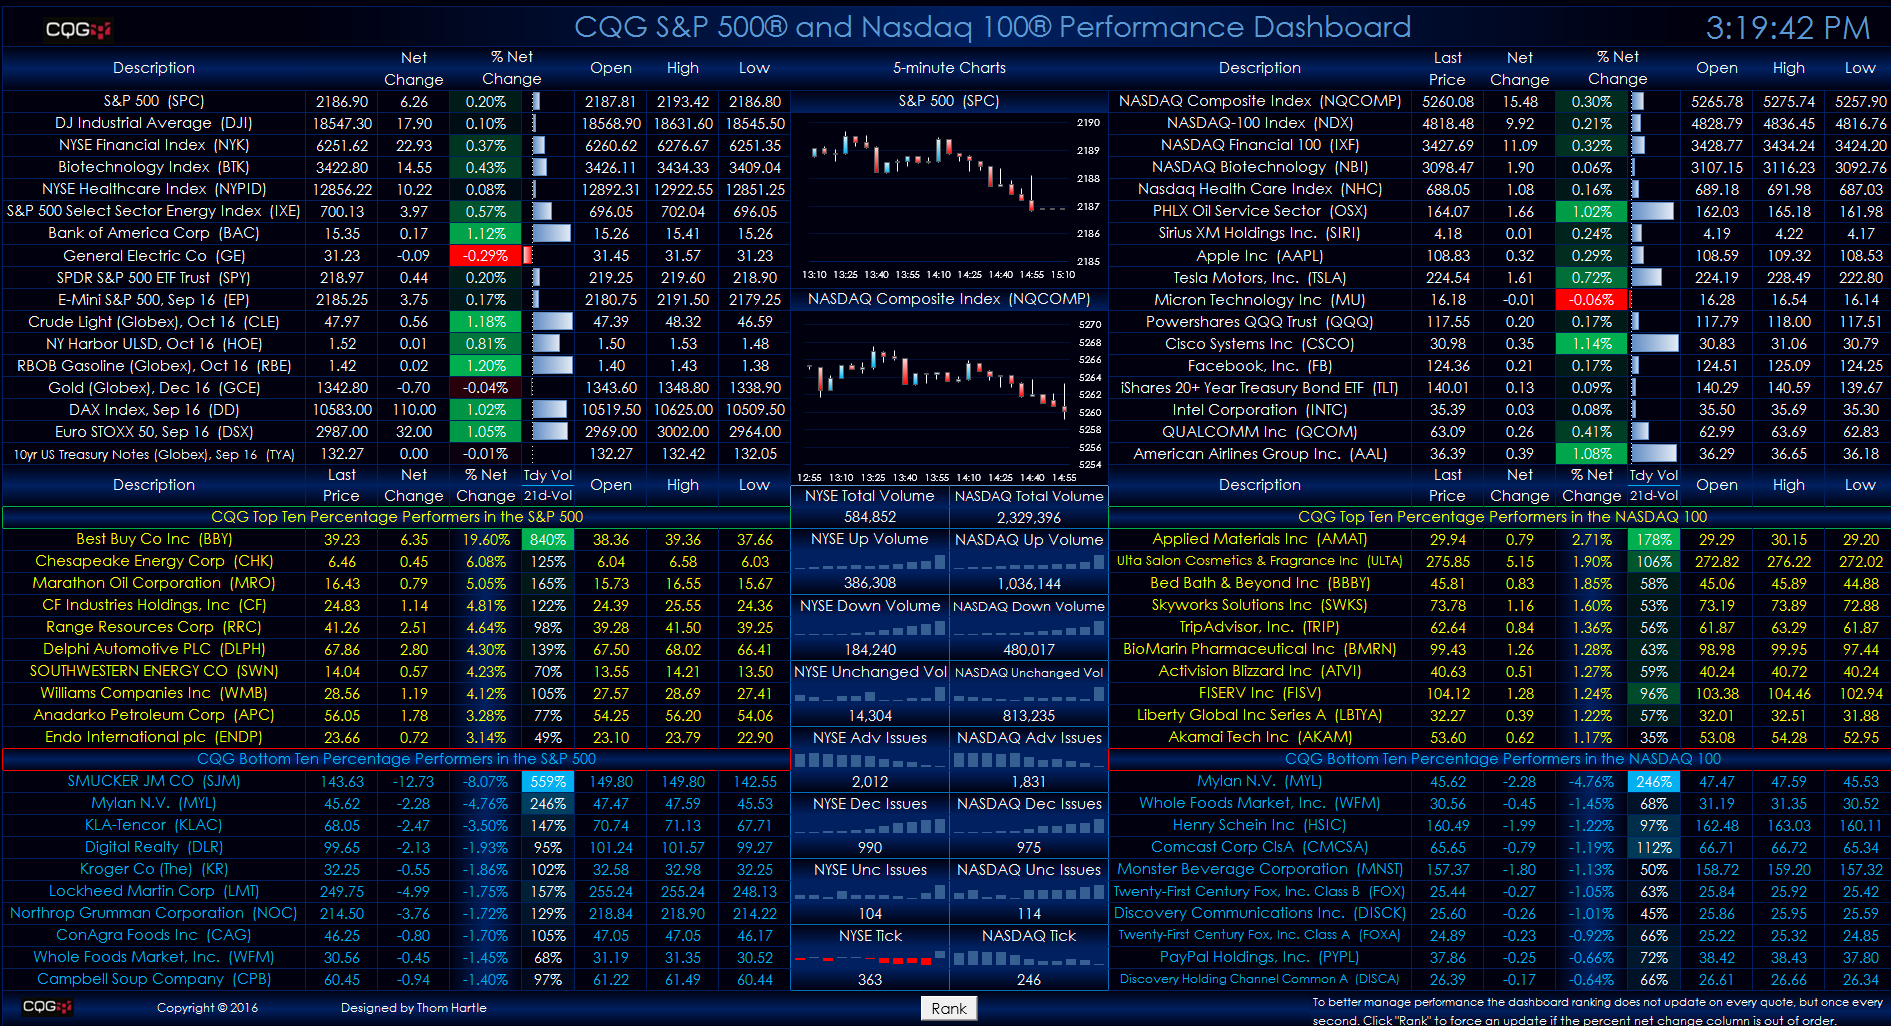
This Microsoft Excel® dashboard offers a two-window view for tracking market performance. The top half displays market data using symbols such as indices, stocks and futures that the user… more