
CQG offers the Moving Linear Regression Line study. When plotted on a chart the line (blue line below) is the endpoint of a best fit line using the least squares technique. This technique finds the line that minimizes the sum of the squares of the distances between each point (closing prices) and the estimated line.
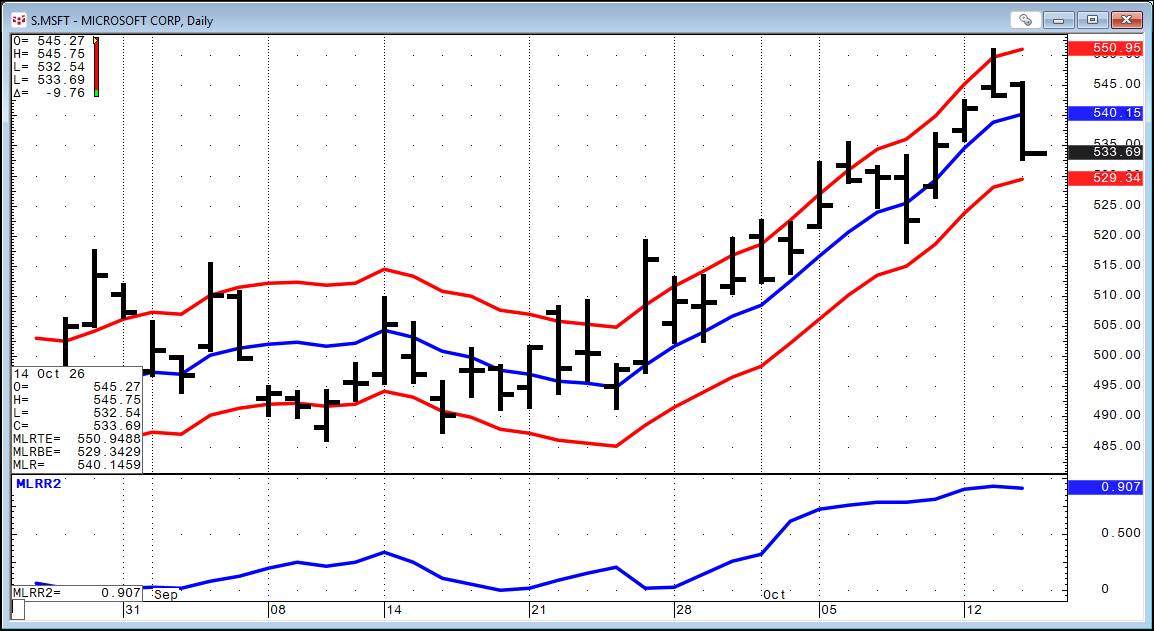
The MLR study includes an upper and lower trading bands and the R squared correlation study which measures the degree of correlation by the MLR study and the prices. This study has a range of 0.00 to 1.00.
This post details the steps to pulling in the MLR study values using RTD formulas. The RTD Formulas are built using the technique where the study, symbol and parameters are passed through the symbol parameter for the RTD call for the Close of a Bar. This post, Calling Custom and Standard Study Data into Excel, explains the method.
The first RTD formula is the Moving Linear Regression line using the symbol "S.MSFT", Period = 20, the Close prices and the Time Frame is Daily (D):
=RTD("cqg.rtd",,"StudyData","MLR(S.MSFT,Period:=20,InputChoice:=Close)", "Bar", "", "Close","D","0",,,,,"T")The MLR Study has upper and lower trading bands or envelopes. These RTD calls use 2%:
=RTD("cqg.rtd",,"StudyData","MLRTE(S.MSFT,Period:=20,Percent:=2.0,InputChoice:=Close)", "Bar", "", "Close","D","0",,,,,"T")=RTD("cqg.rtd",,"StudyData","MLRBE(S.MSFT,Period:=20,Percent:=2.0,InputChoice:=Close)", "Bar", "", "Close","D","0",,,,,"T")Also, the RTD call for the Slope of the regression line is available:
=RTD("cqg.rtd",,"StudyData","MLRSlope(S.MSFT,Period:=20,InputChoice:=Close)", "Bar", "", "Close","D","0",,,,,"T")The Regression line has the Intercept, which is the value (price) of the start of the Regression Line:
=RTD("cqg.rtd",,"StudyData","MLRIntercept(MSFT,Period:=20,InputChoice:=Close)", "Bar", "", "Close","D","0",,,,,"T")If the lookback period for the MLR Study is 20, then the Intercept Price plus twenty times the Slope will equal the MLR Study value.
Finally, the square of the Correlation Coefficient based on the MLR available as an RTD call:
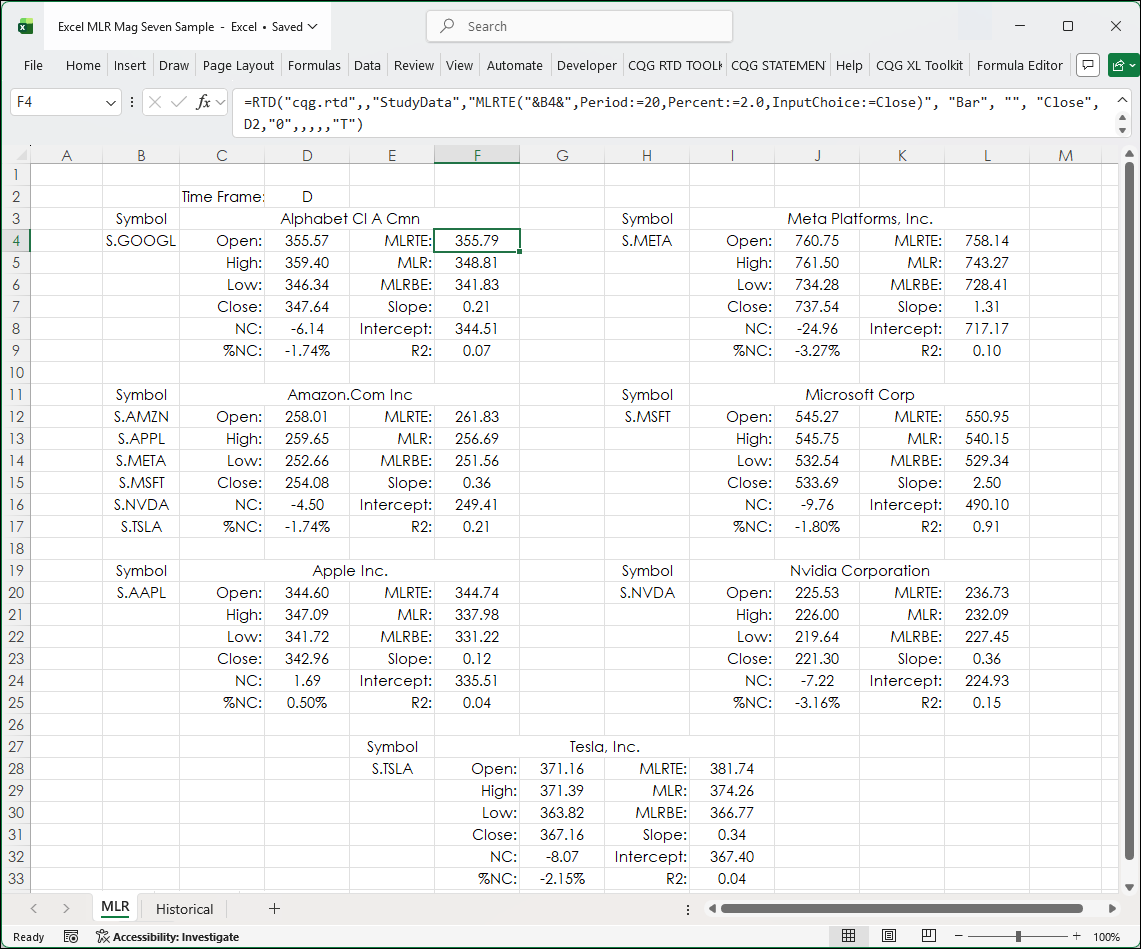
=RTD("cqg.rtd",,"StudyData","MLRRSquared(S.MSFT,Period:=20,InputChoice:=Close)", "Bar", "", "Close","D","0",,,,,"T")The sample spreadsheet available at the bottom of the post is using all of the above RTD formulas plus the Open, High, Low, Last Trade, Net Last Trade, and % Net change for the group of stocks known as the Mag Seven.
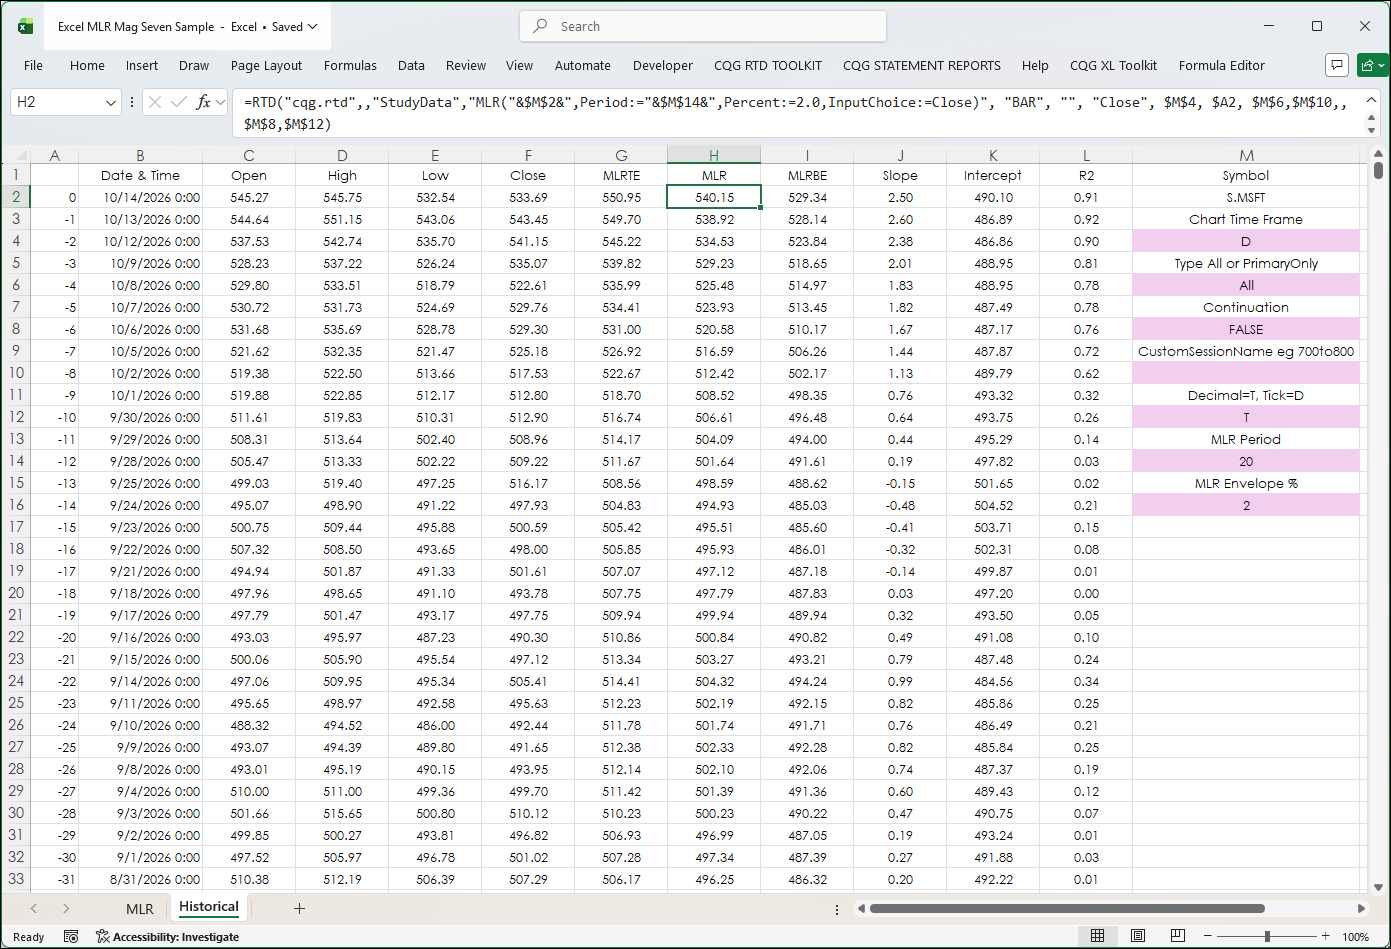
There is a second tab with historical values.
Make sure to lower your Excel Realtime Data (RTD) throttle to 100 milliseconds. Learn how to do that here.
Requires CQG Integrated Client or CQG QTrader, data enablements for the NYSE and Nasdaq stocks, and Excel 2016 or more recent locally installed, not in the Cloud.