
In legacy Excel if a function required the data to be returned to be an array then you had to press Ctrl + Shift + Enter following entering the function. You would see curly brackets surrounding the function.
Today, in Excel you can use curly brackets to create returned data in the form of an array. In the image below are two formulas:
Cell A2 is =TODAY()
Cell B2 is =A2+{7,14,30}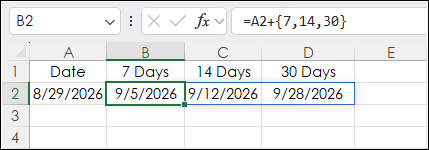
The curly brackets are an Array Constant. Cell B2 has 7, 14 and 30 wrapped with curly brackets added to the date in cell A2 and the three cell array spills over cell B2, C2, and D2.
Another use of the Array Constant is using the VLOOKUP function. The VLOOKUP function arguments are:
VLOOKUP (lookup_value, table_array, col_index_num, [range_lookup])
The third argument is col_index_num or column index number. Only one value from one column is returned.
Using the curly brackets for the column index number enables more than one value being returned.
=VLOOKUP(I6,A6:E22,{2,5},FALSE)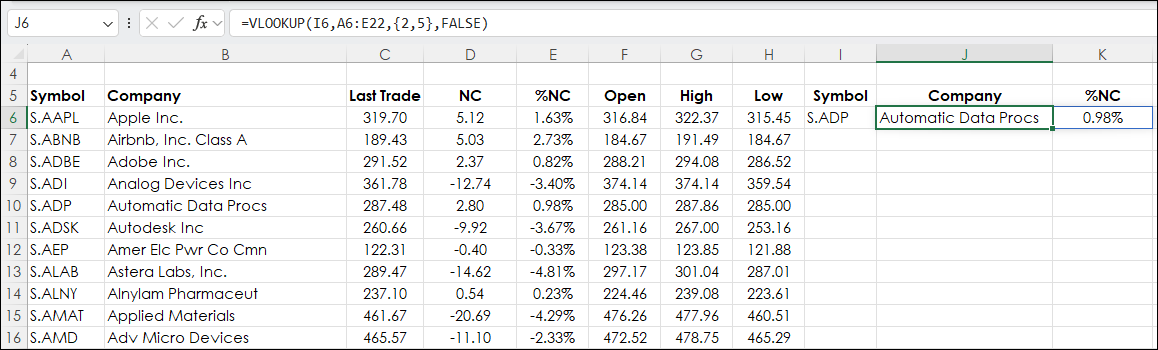
Above, the VLOOKUP function is pulling both the Company Name (column 2) and the %NC (column 5) for the symbol ADP using {2,5}.
This same concept can be used in the table array, which is the second argument in the VLOOKUP function. This use will be the solution to a problem with building multi-market monitoring Excel dashboards.
The problem with building a multi-market Excel Dashboard is the prices have to be manually formatted for decimals as different markets have different numbers of decimals, such as the price of Crude Light has two decimals ($83.44) and the price of RBOB Gasoline has four decimals ($3.0480).
Excel offers the TEXT function that has a parameter for setting the number of decimals:
=TEXT(RTD("cqg.rtd", ,"ContractData","RBE", "LastTrade",, "T"),"#.0000")= 3.0480The "#.0000" uses four decimals formatting for the price.
To format the price with the correct number of decimals requires knowing the number. There is an RTD formula for determining the number of decimals for a symbol and it is the Tick Size:
=RTD("cqg.rtd", ,"ContractData","RBE", "TickSize",, "T") = 0.0001We need the count of integers to the right of the decimal, so the Excel LEN function is used with -2.
=LEN(RTD("cqg.rtd", ,"ContractData","RBE", "TickSize",, "T"))-2 = 4Now, to format the prices with the correct number of decimals the VLOOKUP function is used with an Array Constant used for the "table_array" argument.
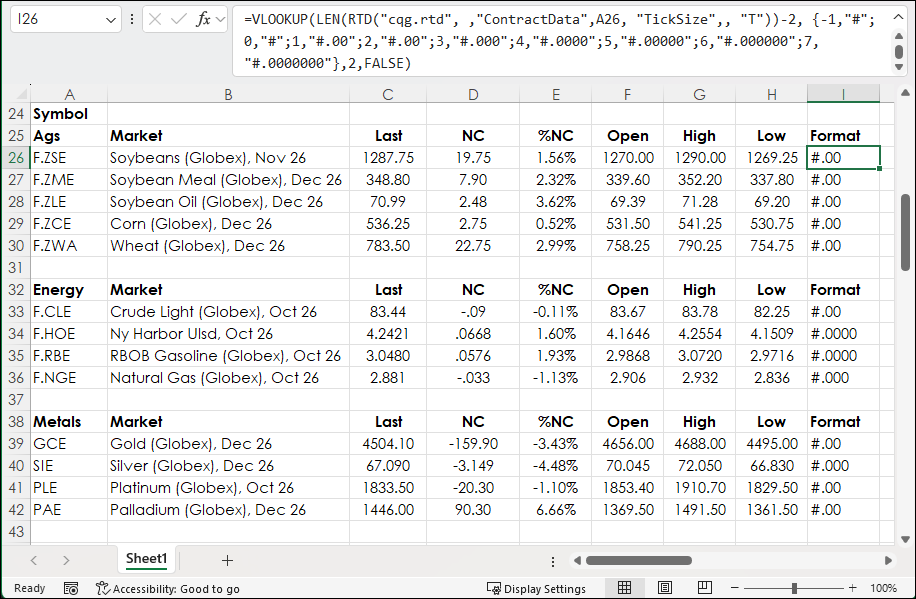
The adjusted Tick Size RTD formula for the symbol in cell A26 is used as the first argument in the VLOOKUP function:
=VLOOKUP(LEN(RTD("cqg.rtd", ,"ContractData",A26, "TickSize",, "T"))-2, {-1,"#";0,"#";1,"#.00";2,"#.00";3,"#.000";4,"#.0000";5,"#.00000";6,"#.000000";7,"#.0000000"},2,FALSE)The Array Constant is used as the second argument:
{-1,"#";0,"#";1,"#.00";2,"#.00";3,"#.000";4,"#.0000";5,"#.00000";6,"#.000000";7,"#.0000000"}The Array Constant has a couple of adjustments. The first parameter is -1,"#"; and that is due to symbol YM (E-Mini Dow) does not have a decimal. Therefore, the adjusted Tick Size returns -1. The Gold contract (Symbol GCE) has only one decimal, but two decimal formatting is used.
All of the prices use the TEXT function with the formatting parameters from column I.
=TEXT(RTD("cqg.rtd", ,"ContractData",A26, "LastTrade",, "T"),I26)One note and that is the prices are Text. Therefore, arithmetic conditional formatting will not work because Excel does not see the values as integers. This can be corrected by using Excel's Double Dash Operator at the start of the function (--)
=--TEXT(RTD("cqg.rtd", ,"ContractData",A26, "LastTrade",, "T"),I26)For more information regarding Excel's Double Dash Operator.
The format column in the downloadable sample can be hidden.
Requires CQG Integrated Client or CQG QTrader, data enablements for the exchanges, and Excel 365 or more recent locally installed, not in the Cloud.